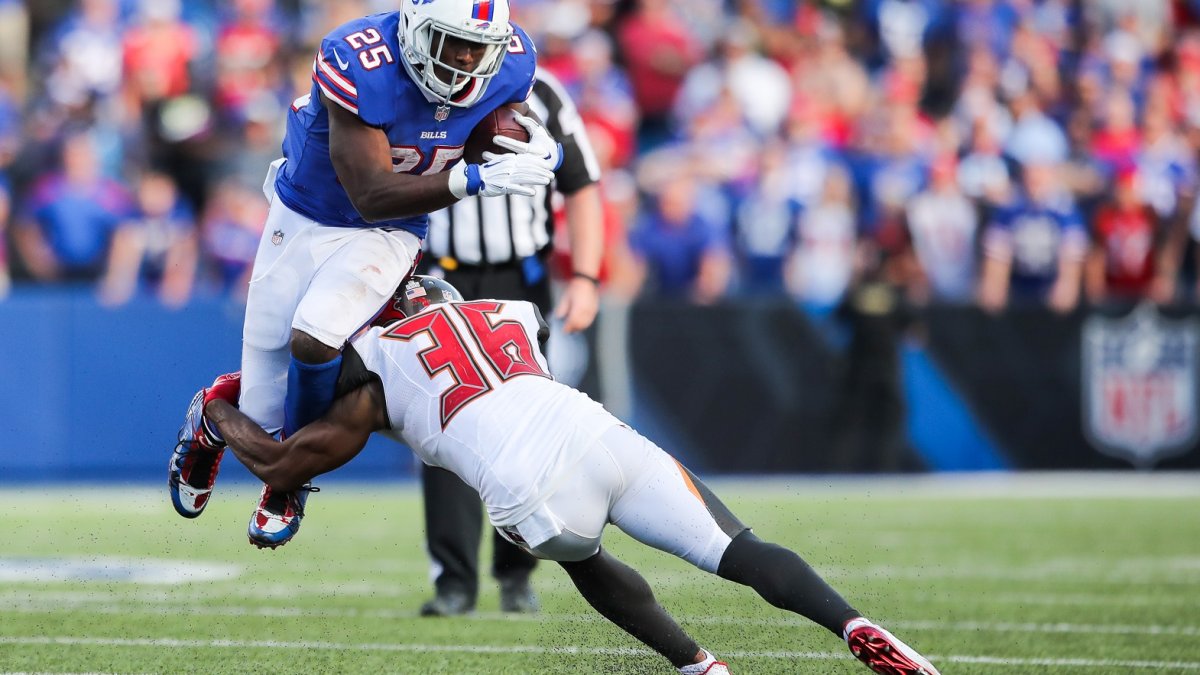
Based on my research, there are six prominent factors that determine how difficult a rushing attempt will be: distance from the end zone, down and distance, score differential, number of defenders in the box, ball-carrier’s position, and yards before contact. With those established as play parameters, I created an expected rushing model with a machine-learning algorithm that is analogous to the one I created for expected receiving. Then, as I did for receivers, I ran a Sagarin-style credit and penalty distributor that gives rushers more credit or less penalty for their production when they face good run defenses and less credit or more penalty when they face bad run defenses. In the end, I could calculate the total Yards Added or Lost by each rusher each season since 2009, and the results looked reasonable to my eye test.
| Rushing Yards Added Leaders, 2017 | ||
| Rusher | Att | Yards Added |
| Kenyan Drake | 134 | 106 |
| LeGarrette Blount | 173 | 96 |
| Kareem Hunt | 272 | 92 |
| Mark Ingram | 230 | 85 |
| Derrick Henry | 176 | 78 |
| Marshawn Lynch | 208 | 71 |
| Todd Gurley | 260 | 60 |
| Alvin Kamara | 120 | 52 |
| Alex Collins | 212 | 50 |
| Bilal Powell | 178 | 44 |
Exclusive content for premium subscribers

WANT TO KEEP READING?
Dominate Fantasy Football & Betting with AI-Powered Data & Tools Trusted By All 32 Teams
Already have a subscription? Log in


 © 2025 PFF - all rights reserved.