I’m always curious about how certain events can affect certain players differently, and then what that might mean for us as fantasy players. In today’s case, that means an in-depth dive on the topic of gamescript.
In each chart below, broken down by position, we’re looking at how often a player’s team was trailing or leading (in games that player saw the field last season) and each player’s fantasy splits in both categories. The difference between these numbers represents how much a player benefited from a specific gamescript (in this case, either leading or trailing). The more “gamescript-sensitive” players will be the ones on either end of the chart.
By determining how gamescript-dependent a player was last season, we should be able to make some educated guesses about their role next season. If a team’s quarterback scored a high percentage of his fantasy points when trailing last season, and the inverse was true for the running back, we might surmise that the team “played it safe” when ahead in games. This might mean that if the team had a game against the Patriots (unlikely to be leading), the quarterback might be an interesting and underpriced DFS play that week.
Quarterbacks
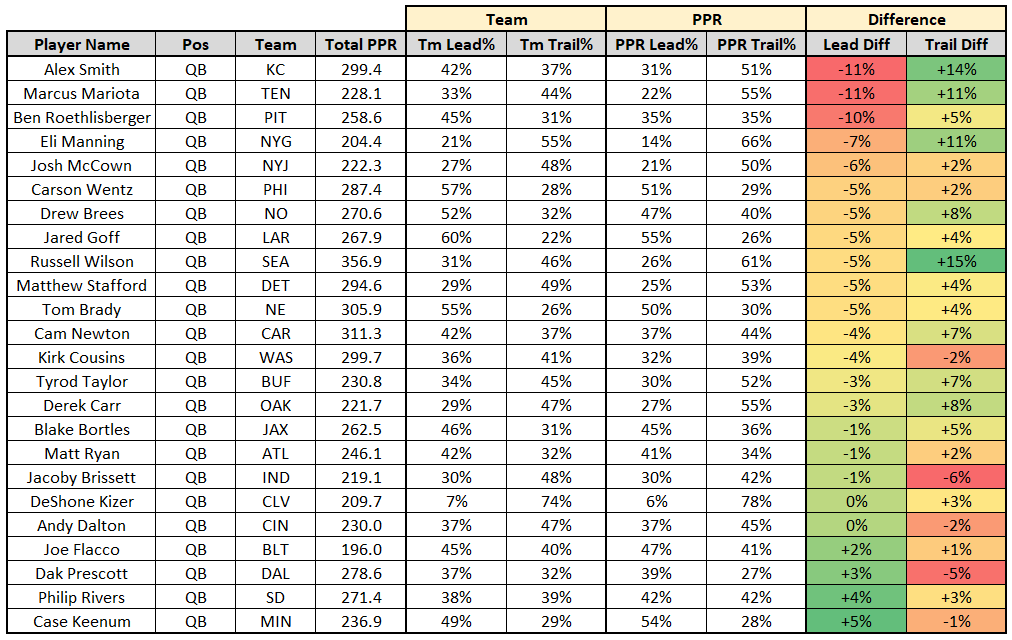
As evident in the chart above, quarterbacks are typically far more productive when trailing. This makes sense intuitively — when there’s more of an urgency to put points on the board, teams will run less and throw more. Last season, on average, teams passed 66 percent of the time when trailing, but only 49 percent of the time when leading.
Alex Smith was our most gamescript-dependent quarterback in 2016, and again he topped the list for 2017. This wasn’t a surprise at all, considering Smith has long held a reputation of being a game manager. However, after digging deeper into the data it seems he wasn’t exactly used as a game manager in 2017 (though he was in 2016). 39 percent of his pass attempts came when leading, which is actually a fairly high number in contrast to the fact this his team led 42 percent of the time. Russell Wilson also seemed gamescript-dependent, but, just like with Kansas City, Seattle ranked top-five in pass percentage when leading. It seems both quarterbacks, for whatever reason, were just far more efficient when trailing.
This was not the case for Marcus Mariota, Eli Manning, or Ben Roethlisberger, however. All fit the profile better as game managers, seeing a significant uptick in pass attempts and fantasy production when trailing versus when leading.
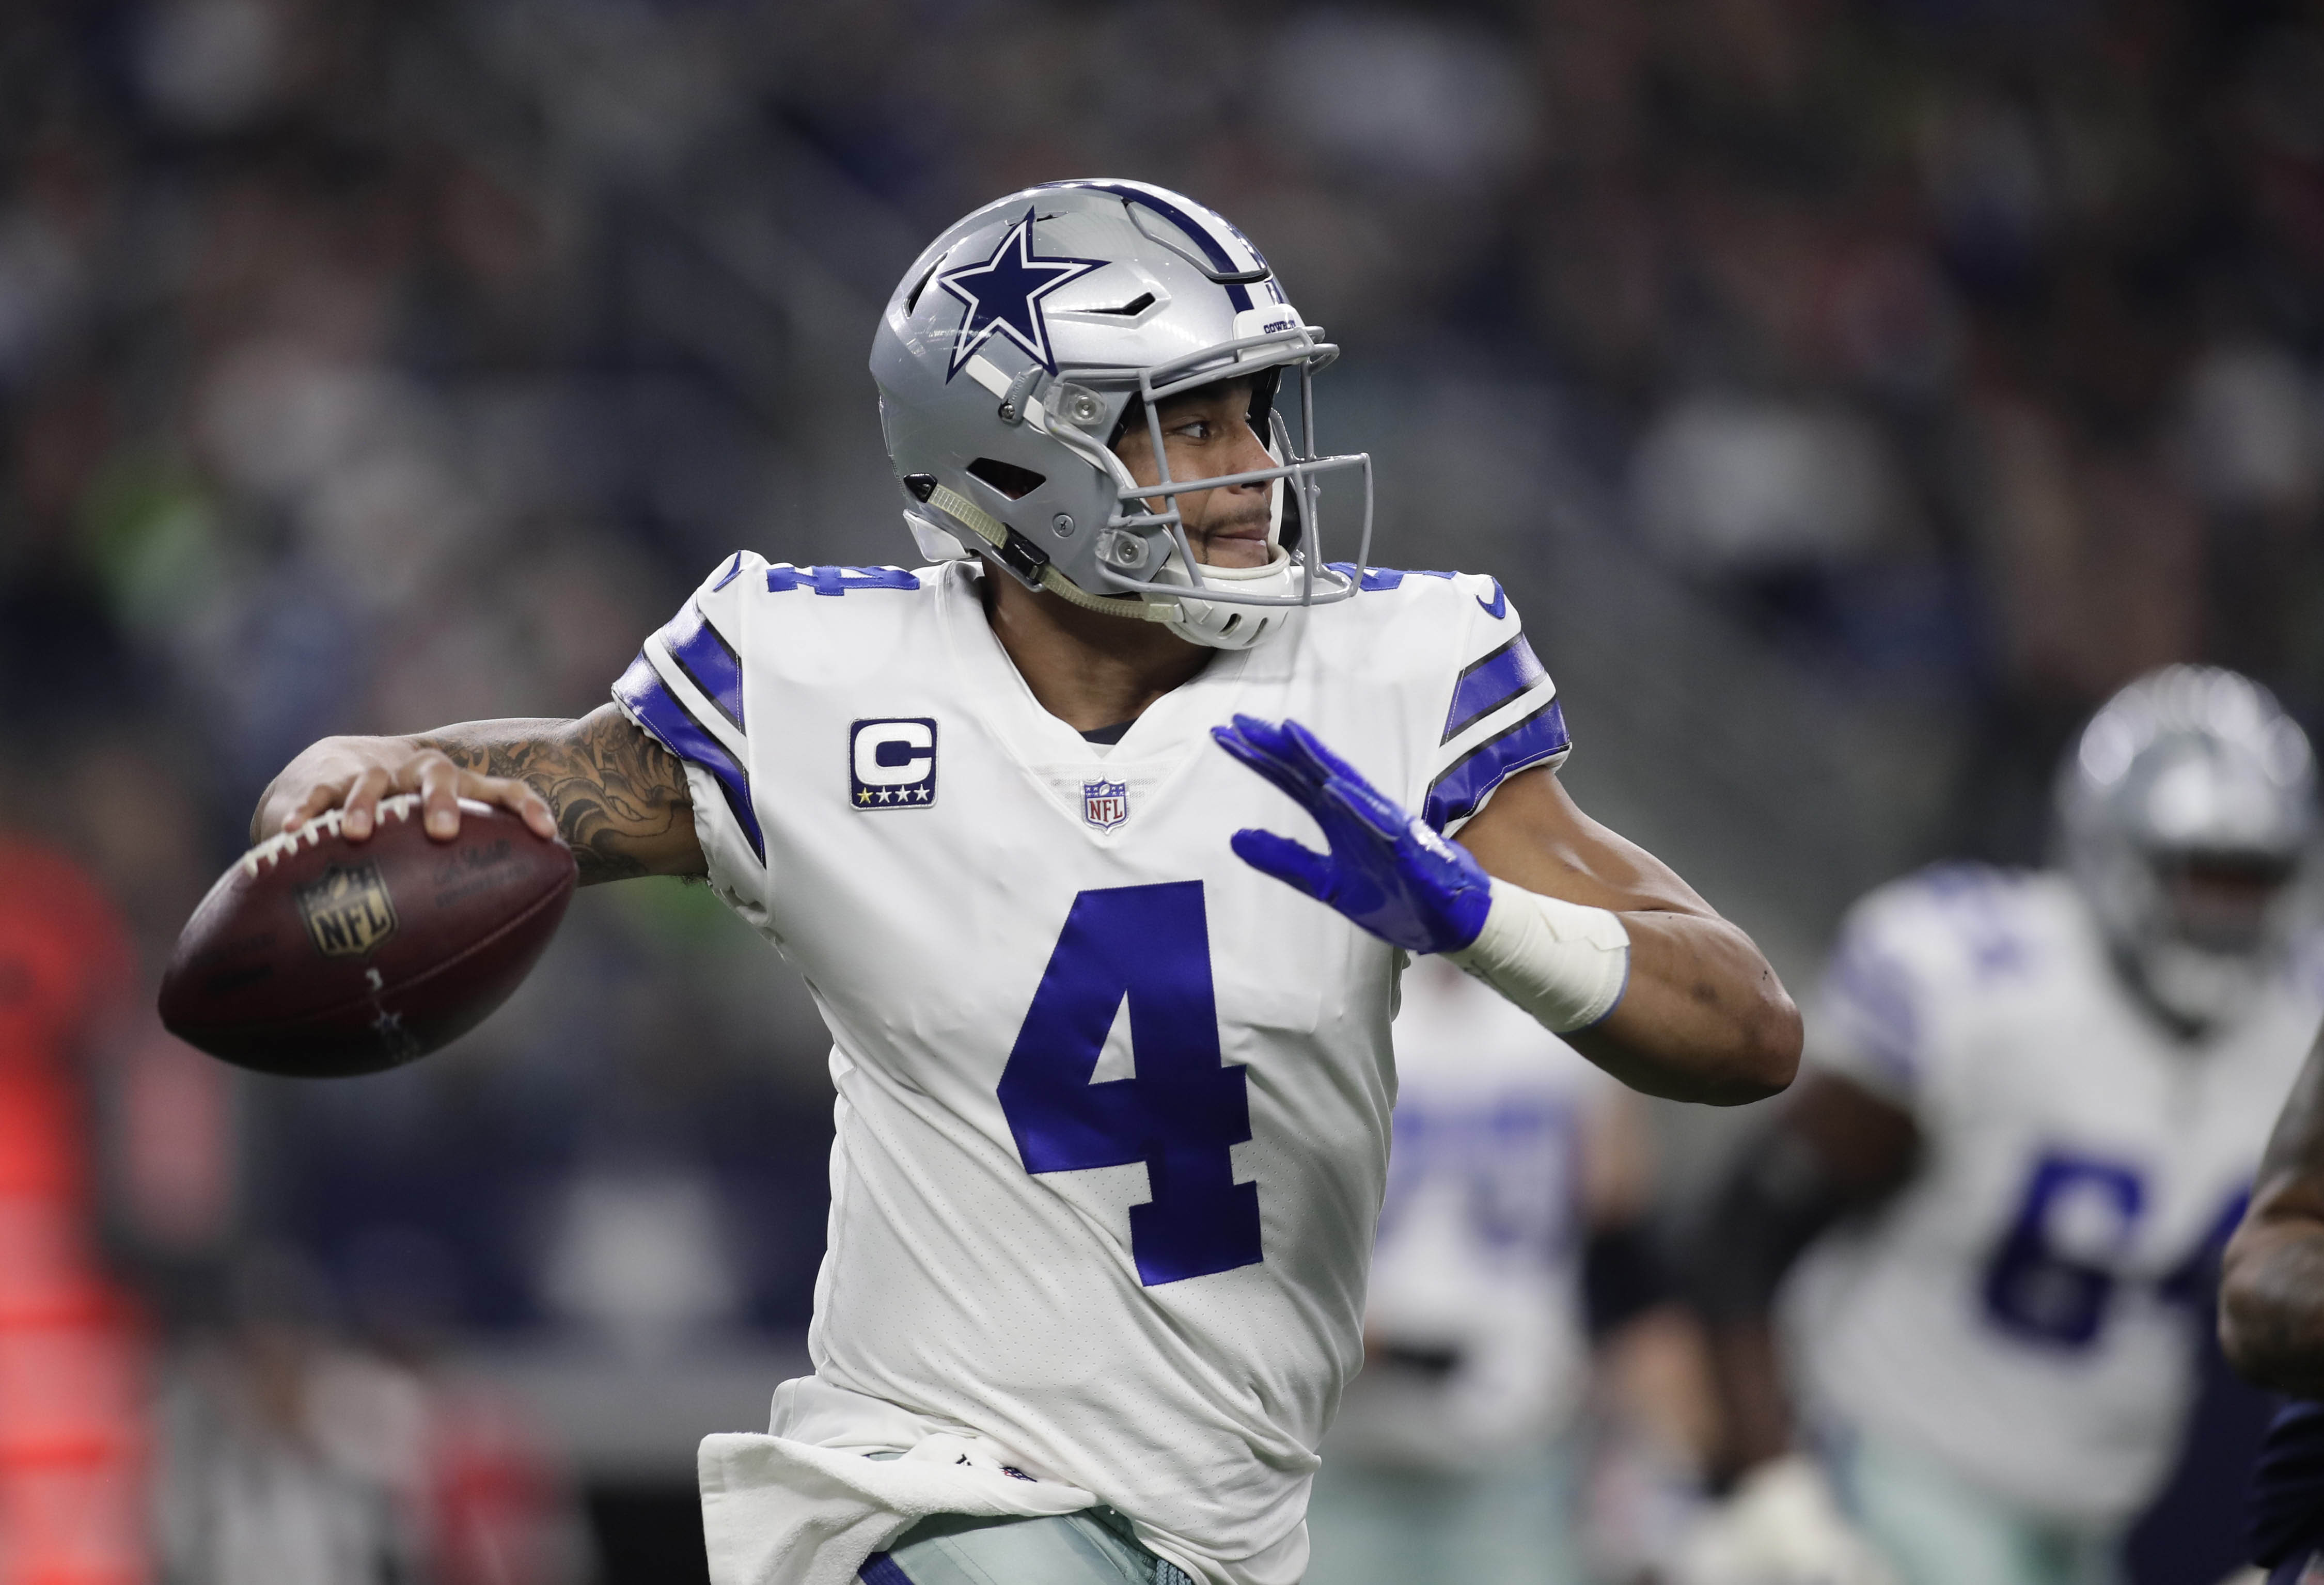
I’m not reading too much into Case Keenum or Philip Rivers‘ rankings on the other end of the spectrum (considering their passing splits didn’t match up with their production splits), but I do think it’s noteworthy for Dak Prescott. Prescott certainly fit the stereotype of a game manager, with pass differentials in line with Mariota and company, but it’s interesting to note his production went in the opposite direction, and I think I know why. Last year, Prescott averaged 19.6 fantasy points per game when Ezekiel Elliott was on the field, but only 13.8 fantasy points per game in the six games Elliott was absent. I wonder if part of his fantasy value isn’t heavily tied to defenses selling out to stop the run (Elliott) and boosting his efficiency numbers as a result. Remember, defenses are more fearful of the run when the offense is holding a lead.
Running backs
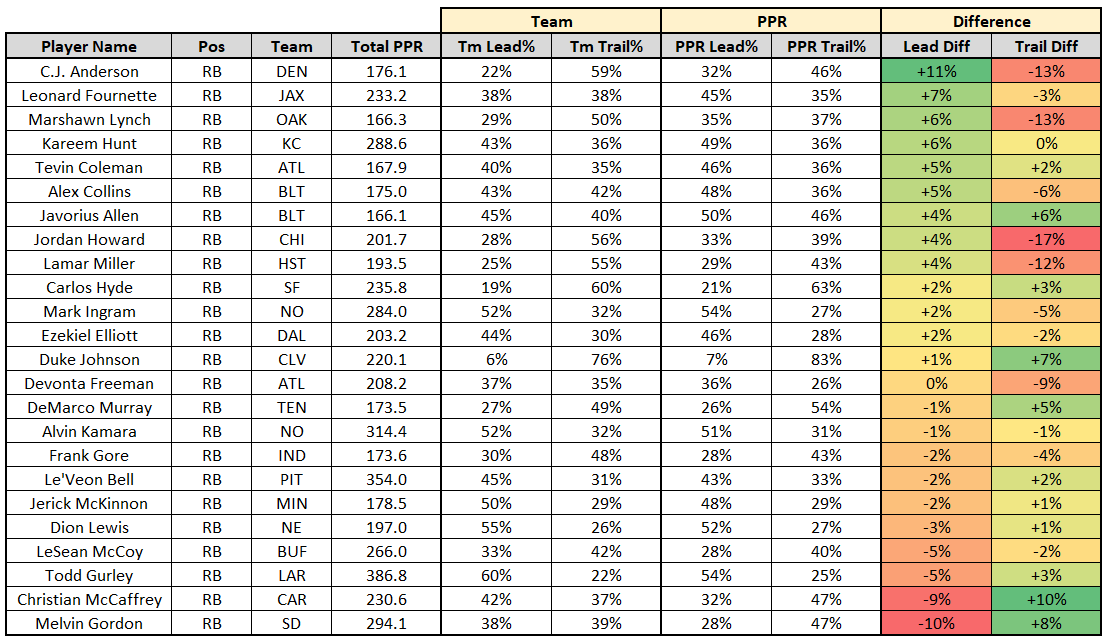
While all other positions benefited from negative gamescript, the opposite was true for the running back position.
The running backs who benefited the most from positive gamescript (and were the most hurt by negative gamescript) were Jordan Howard, C.J. Anderson, Leonard Fournette, Marshawn Lynch, Alex Collins, and Lamar Miller. All of these names, outside of maybe Miller, make perfect sense. None of these running backs were their team’s strongest pass-catcher, so when their team is trailing (teams run more frequently when leading) they’d pull out their workhorse and substitute in a more-capable pass-catching back. When the team was leading, they’d go run-heavy and let their workhorse dominate touches and take time off the clock. While Miller did lead his team in RB targets, his presence here is likely better explained by his splits with and without Deshaun Watson. Three of Houston's four wins came with Watson under center, and Miller averaged 3.45 more fantasy points per game when Watson saw the field (likely due to lighter fronts and more red-zone opportunities).
On the opposite end of the spectrum, the following running backs benefited most from negative gamescript (and were most at a detriment under positive gamescript): Melvin Gordon, Christian McCaffrey, Todd Gurley, Duke Johnson, and DeMarco Murray. In each case these running backs were the team’s primary pass-catching running back. Johnson and McCaffrey should make sense intuitively, as so much of their production comes as a receiver, but Gordon, Gurley, and Murray may come as surprises. I think the important stat here is that, in PPR leagues, a target is worth 2.64 times as much as a carry for fantasy running backs. Gordon saw 54 percent of his targets when trailing (just 39 percent of the time) and Murray saw 60 percent of his targets when trailing (49 percent of the time). This wasn’t entirely the case for Gurley, but his numbers can be partly explained away by the fact that Los Angeles won a whopping 33 percent of his games by 25 or more points. So, when these games got out of hand Malcolm Brown would come on in relief.
Murray was near the top of this list in 2016 as well, and I suspect Dion Lewis will be used in a similar capacity in 2018. Dating back to college, Derrick Henry has always ranked near the bottom of the league in routes per snap and pass-blocking efficiency.
Although DFS players like to target running backs likely to win their games, and while that correlation is usually correct, it depends on the specific running back and their role. For instance, as the data here suggests, I’d be more inclined to play a pass-catching running back in a game they’re likely to be trailing throughout.
Wide receivers
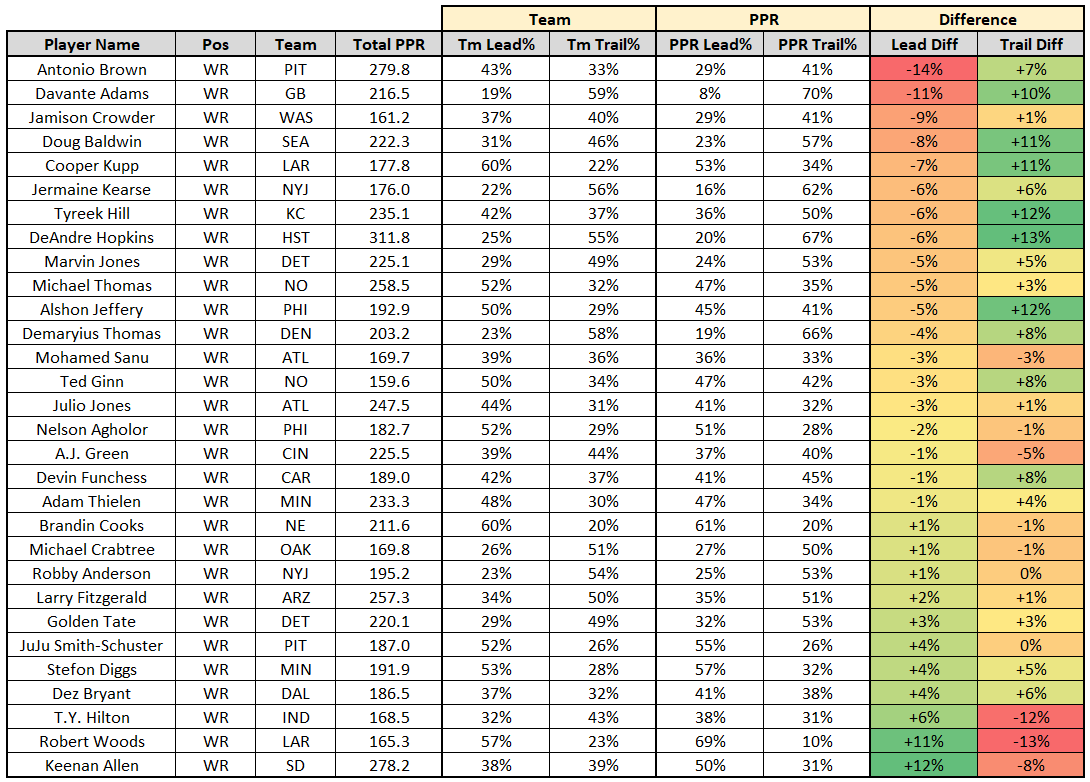
Like with quarterbacks, you’ll see all wide receivers benefited greatly when their team was trailing. This makes sense considering how heavily a wide receiver’s production is tied to their quarterback.
Jamison Crowder, Antonio Brown, DeAndre Hopkins, Davante Adams, and Cooper Kupp all ranked as some of our most gamescript-sensitive wide receivers, overperforming when trailing and underperforming when leading. What’s especially interesting is that these differentials were all backed up by volume as well. Crowder led the way with 55 percent of his targets coming when trailing, despite only trailing 40 percent of the time. Brown wasn’t too far behind, with 44 percent of his targets coming when trailing (33 percent of the time). Perhaps this had something to do with rapport – these quarterbacks would lean heavy on their most trusted receiver when the game was in jeopardy. Perhaps, like with pass-catching running backs, these players are worthy of getting a bump in DFS weeks their team is likely to be trailing.
On the opposite end of the spectrum, A.J. Green, T.Y. Hilton, Keenan Allen, and Robert Woods all stood out as being more productive when leading than trailing, which is unusual for receivers. I’m not sure why this was the case, but volume again fell in line with production. Green, for instance, saw only 38 percent of his targets when trailing (44 percent of the time). I’m not sure what to make of this other than disappointment in Bill Lazor who seems not to have learned from Ken Zampese’s mistakes. In Allen's case, I'll just note that he averaged 2.4 more targets per game and 7.9 more fantasy points per game in victories than losses last year. It seems the team would be better off if they got him more involved next year, and especially so with Hunter Henry out for the year.
Tight ends
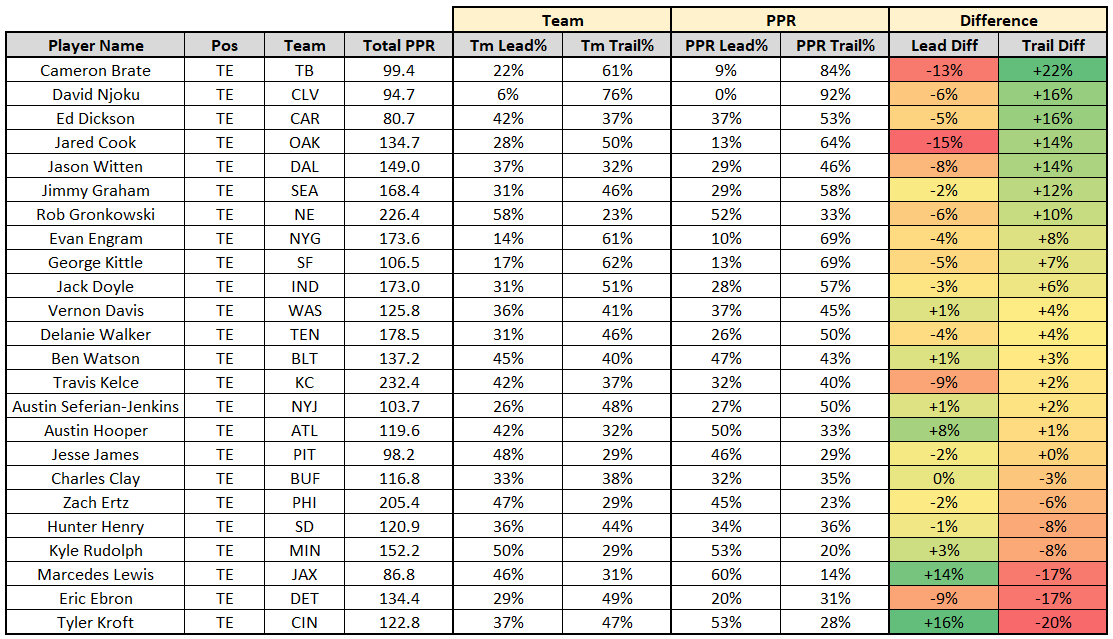
With tight ends, we see a similar trend to wide receivers — an increase in scoring when trailing. We also see a few tight ends posting similar splits to that of their quarterback.
Of all of these names, the most significant one is Cameron Brate. Brate led the league with a +22-percent trail differential this season, after posting a league-leading +19.0 percent the year before. Last season, 77 percent of his targets came when trailing, though the team trailed only 61 percent of the time in his games. This differential led all tight ends. The year before, 68 percent of his targets came when the team was trailing, though Tampa Bay trailed on only 49 percent of their snaps. Again, he led all tight ends. This seems like too much to just be a coincidence. I’ll be boosting up Brate in my rankings in games Tampa Bay is likely to fall behind.


 © 2025 PFF - all rights reserved.