No, Austin Ekeler isn’t a more talented running back than Melvin Gordon. Ekeler’s two-year rushing grade (79.5) and forced missed tackle per attempt average (0.14) both fall second to Gordon during that time span. And Ekeler’s two-year total in terms of carries (164) pales in comparison to Gordon’s (485), making it that much harder to justify Ekeler as a better running back than Gordon.
Ekeler is just good enough to replace Gordon’s production at a position where production is largely dependent on factors outside of the player’s talent level.
Rushing production is far more dependent on scheme, box count, down & distance and the blocking ahead than the talent of the runner himself, according to the research PFF’s data scientists Eric Eager and George Chahrouri. Adding to the position’s replaceability, other research from Eager and Chahrouri has shown that how productive a running back is catching the football is not as stable as a receiver’s or tight end’s receiving production, making it that much more disadvantageous to allocate significant resource (e.g. cap space, draft capital) into talented pass-catching backs over talented receivers or tight ends.
Gordon, like all backs in the NFL, can’t avoid the fact that his rushing production is largely replaceable and his production as a pass-catcher is volatile. His value is low as a result, and Ekeler — who is due roughly $650K in 2019 — offers similar value with a much cheaper price tag than the former first-round draft pick out of Wisconsin.

EKELER HAS PROVEN EFFICIENT ACROSS SMALL SAMPLE SIZE
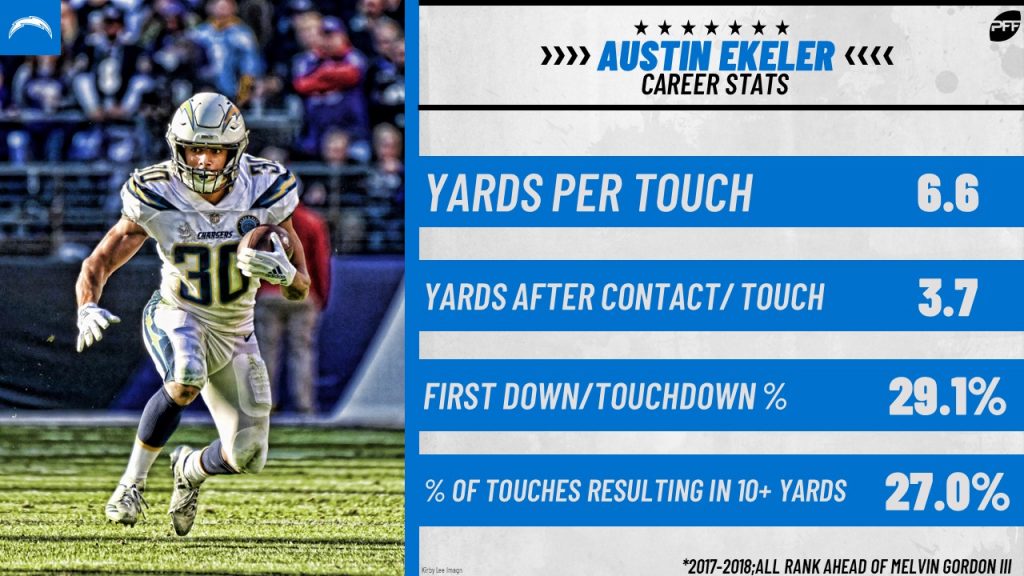
Ekeler, an undrafted signee out Western Colorado University, has totaled 1,559 yards, 871 yards after contact, 69 combined first downs and touchdowns, 51 forced missed tackles and 64 gains of 10-plus yards in his two-year NFL career. His career averages in yards per touch (6.6), yards after contact per touch (3.7), first down/touchdown percentage (29.1%) and percentage of touches resulting in 10 or more yards (27%) all rank ahead of Gordon’s respective averages in the last two seasons.
The Los Angeles Chargers generated positive expected points added (EPA) when targeting or handing the ball off to Ekeler 49.4% of the time over the past two seasons, which is roughly 6% better than Gordon. In fact, Los Angeles' two-year positive EPA percentage favors Ekeler over Gordon on early-down runs (47% vs. 39%), all runs (46% vs. 40%) and all targets (55% vs. 54%).
Isolating the sample size to runs on early downs between the 10-yard lines over the past two seasons, the Bolts generated positive EPA running Ekeler on 47% of 140 attempts. With Gordon, Los Angeles generated positive EPA on 38% of 379 such runs in the two-year span.
“BUT GORDON COMMANDS MORE RESPECT FROM THE DEFENSE!”
Gordon does see more loaded boxes than Ekeler. Over the past two seasons, Gordon has faced defenses with eight or more defenders in the box on 30.6% of his offensive snaps, while Ekeler has seen eight or more defenders in the box on just 21.8% of his offensive snaps in the same two-year span. That difference plays a part in why Gordon’s rushing success rates are lower across the board.
The connection between rushing success and box count is well documented. Running into loaded boxes is more difficult than running into ones with seven or fewer defenders.
Per Josh Hermseyer of FiveThirtyEight, “Running backs with at least 20 carries averaged 4.75 yards per carry against six men in the box from 2016 to 2018. That’s well over half a yard higher than the average of 4.09 yards per carry when that same group of runners faced seven defenders near the line of scrimmage. Against eight-man fronts, the average gain falls to 3.59.”
But Gordon sees a higher percentage of loaded boxes because of his usage, not his ability. Down and distance, field position and personnel all play a bigger role in dictating box count than the ability of the runner on the field. When controlling for the aforementioned factors, the difference between Gordon and Ekeler in terms of loaded boxes faced is minimal.
Gordon has faced eight-plus box defenders on 5.2% (27-of-523) of his offensive snaps in between the 10-yard lines on early downs in 11 personnel (1 RB, 1 TE, 3 WR) — the Chargers’ top personnel grouping in terms of usage percentage — over the past two years. In the same situation, Ekeler has faced a loaded box on 4.61% (10-of-217) of his offensive snaps, a minimal difference compared to his teammate.
With Gordon seeing more than double the offensive snaps and nearly triple the rush attempts than Ekeler in personnel groupings heavier than 11, it’s not surprising his success rates are lower. And Gordon’s higher touch totals in the red zone and short-yardage situations — areas where loaded boxes become more common — also play a part in his lower rushing success rates overall.
EKELER STILL EFFICIENT WHEN CONTROLLING FOR SITUATION
Running into loaded boxes over the past two seasons, Ekeler generated positive EPA on 27-of-63 carries (42.9%) — a strong number across a small sample size that ranks 10th among the 62 backs with at least 50 carries against loaded boxes in 2017 and 2018 combined. Gordon generated positive EPA on 77-of-216 (35.7%) runs against loaded boxes in the same two-year span, ranking 24th among the 42 NFL running backs with at least 100 attempts against loaded boxes.
As previously mentioned, Ekeler’s positive EPA percentage on early-down runs (47%) ranks ahead of Gordon’s (39%). Expand the sample size to all early-down opportunities (targets and carries), and Ekeler beats out Gordon in positive EPA percentage, again (50% vs. 38%).
Ekeler has also had significant success when facing early adversity on the ground. Among the 75 NFL backs contacted at or behind the line of scrimmage on 50-plus carries in the past two seasons, Ekeler ranks fourth in yards after contact per attempt (3.68) and first in yards per carry (2.44) on such disadvantageous attempts. Gordon ranks 33rd in both respects on the same list.
And no matter where you slice it, Ekeler has proven to be the more efficient receiving back between the two. Not only has he generated a higher success rate on targets than Gordon (45% vs. 35%), but he’s also averaged more yards per route run (2.06 vs. 1.66) and generated a higher passer rating when targeted (123.9 vs. 112.9) over the past two seasons. Ekeler’s career receiving grade (89.9) is 21.5 grade points higher than Gordon’s two-year receiving grade (68.4).
FINAL THOUGHTS
Of course, small sample size plays in Ekeler’s favor with all of the above statistics, and past performances are often not indicative of future results, including and especially for running backs in the running game. Gordon accumulated 595 touches in 2017 and 2018 combined, while Ekeler had just 237. It’s more than fair to expect Ekeler to regress across a larger touch total in Gordon's absence, but the severity of the regression may be overstated considering Ekeler’s efficiency regardless of the situation. And such a regression would likely serve as an incentive for the Chargers to be more efficient offensively, running less on early downs while utilizing Hall of Fame quarterback Philip Rivers while they still have the chance.


 © 2025 PFF - all rights reserved.