Quarterback is the most important position in all of team sports, and while the reigning Super Bowl champions were able to win a title without their starting quarterback, the perceived value of players at the position has never been higher. As such, robust measures of ability at the quarterback position need to be developed and analyzed for their ability to capture efficacy on a season-to-season basis.
Traditionally, touchdown passes and interceptions (or their ratio) have been the means by which we’ve evaluated how good a quarterback has played in given season or career. This has been reasonable, as many of the truly great quarterbacks have had fantastic TD/INT ratios (Aaron Rodgers 45 TD/6 INT 2011 season comes to mind), while the truly poor quarterbacks have even thrown more interceptions than touchdowns during the course of a season or career (e.g. the 2016 Brockening). These two measures make up much of the traditional NFL passer rating formula. This formula would put Alex Smith ahead of Tom Brady this past season (104.7 vs. 102.8), even though Brady ended up winning the NFL MVP award while Smith didn’t earn a single vote.
Era differences aside, there are issues associated with using touchdowns and interceptions to evaluate quarterback play.
An obvious issue is opportunity; some teams run the ball more than they throw it in the red zone, leading to lower touchdown numbers. Another is luck. That’s right, luck. Sometimes a quarterback throws a perfect pass and it’s dropped in the end zone by the receiver (we feel your pain, 2017 Matt Ryan), or a quarterback throws a pass any NFL quarterback could make, and, via a brilliant play by his receiver at the catch point or after the catch, he is later awarded a touchdown pass (we see you, 2016 Matt Ryan).
The same things can be said for interceptions. An interception can come in the form of a truly bad pass, or a perfect pass that is deflected by a receiver into the arms of a lucky defender, and everything between (butts included, Marshon Lattimore). A poorly-thrown pass can be dropped by a defender as well and thrown into the pile of incompletions that no one remembers in the long run.
(Subscribe to the PFF Forecast for more on this, and other analytical discussions about Pro Football Focus with Eric Eager & George Chahrouri)
PFF grading aims to isolate the play of individuals from the rest of the team. This gives a clearer picture of a quarterback’s performance independent of whether his teammates follow through with their end of the bargain. Using the quarterback’s throw grade to determine when he makes a truly exemplary play or a throw deserving of a turnover, instead of simply counting touchdowns and interceptions, seems like a much better method for analyzing performance.
Looking at the levels of grade that senior analysts Steve Palazzolo and Sam Monson eloquently outlined in their piece on quarterback grading, we can find a fairly straightforward stand-in for touchdowns and interceptions. On the plus-side, “big-time throws” (BTT) earn the highest level of grade and can be “best described as a pass with excellent ball location and timing, generally thrown further down the field and/or into a tighter window,” to quote Palazzolo and Monson. Just 4.4 percent of attempts have earned this distinction since 2014 (same rate as touchdowns, interestingly) and resulted in a passer rating of 158.1. However, these great throws result in a touchdown only 28.6 percent of the time, further emphasizing the reason for using them.
On the flip side, we can look to “turnover-worthy throws” (TWT) as a better representation of when a quarterback makes a bad play, these throws earn the lowest level of grade and are summed up nicely in Sam and Steve’s article. Turnover-worthy throws occurred on 3.4 percent of attempts since 2014, resulted in a passer rating of 0.9 and an interception rate of 46.1 percent. All other throw grades resulted in an interception just 2.3 percent of the time.
As football analytics proverbs go, one of the best is that “processes are more stable and predictive than results are.” We showed in a previous article how pressures (the process that can generate sacks) are more stable than sacks. The same is true for PFF grades for quarterbacks. For players with more than 140 dropbacks in back-to-back seasons in the PFF era (2006-2017), the rate of positively-graded throws (correlation coefficient = 0.41), negatively-graded throws (0.51), TWT (0.38) and BTT (0.28) are all more stable than the proportion of throws that end up in touchdowns (0.27) and interceptions (0.18) on a year-to-year basis.
Passer rating is correlated year-to-year at a rate of 0.39 (updated from the QB annual with 2017 data), on the back of more-stable metrics like completion percentage (0.55) and, to a lesser degree, yards per attempt (0.36) embedded in its formula. If we take out touchdowns and interceptions, and replace them with BTTs and TWTs, we find that this adjusted quarterback rating is 0.48 – an increase of 23 percent.

(Passer rating for quarterbacks in year N (x-axis) and N+1 (y-axis) is shown in blue while adjusted passer rating is shown in green illustrating a tighter correlation)
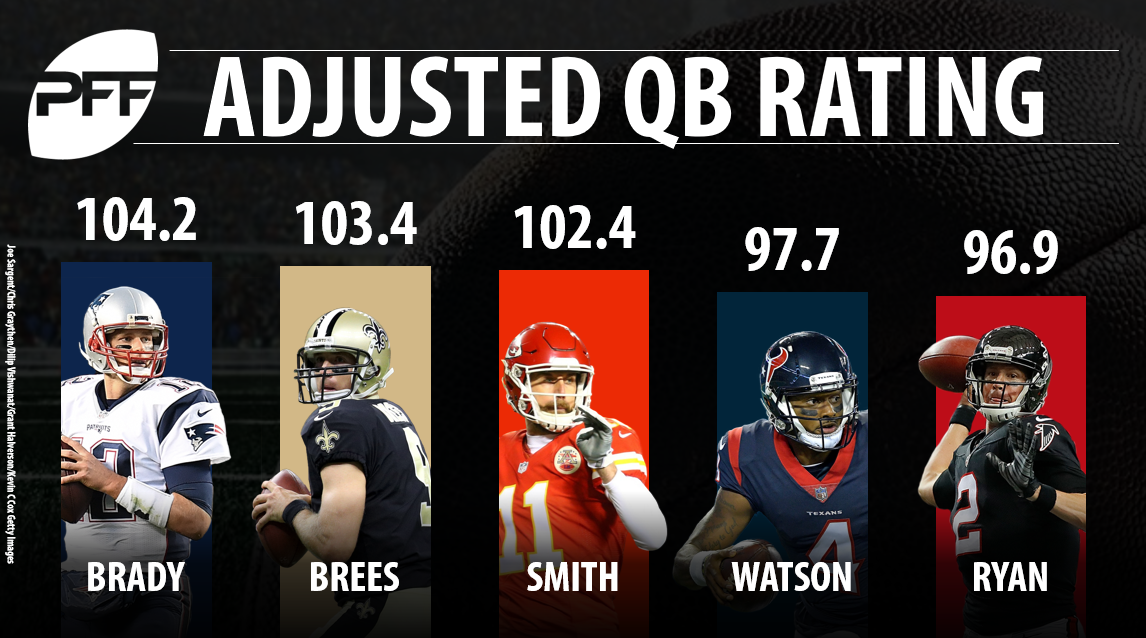
Here are the top five players from the 2017 season in adjusted quarterback rating with at least 170 dropbacks (39 quarterbacks):
1. Tom Brady – 104.2
2. Drew Brees – 103.4
3. Alex Smith – 102.4
4. Deshaun Watson – 97.7
5. Matt Ryan – 96.9

While the 2017 leader in passer rating, Smith, still had a phenomenal season by our grades, he takes a step back here in relation to Brady and Brees due to having more than twice as many TWTs (11) as actual interceptions (five). Rookie Deshaun Watson makes the list, despite his actual passer rating (103.0) eclipsing his adjusted rating 97.7 by more than five points which illustrates some of the interception luck he had this season while leading the league in big-time throw rate. Unsurprisingly, Brady vaults to the top on the strength of top-5 big-time throw percentage and turnover-worthy throw avoidance.
Here are the bottom five players from the 2017 season in adjusted quarterback rating:
35. Jay Cutler – 69.7
36. Brett Hundley – 67.2
37. DeShone Kizer – 63.3
38. Blaine Gabbert – 61.7
39. Brock Osweiler – 59.0
In this group, only Cutler managed a traditional passer rating over 80.0, but his 39th-ranked BTT rate saw his adjusted rating crater from 26th to 35th. Each of these quarterbacks had more TWT than BTT, with Osweiler “leading” the pack at a ratio of 3:1. Gabbert, Hundley and Kizer each rank in the bottom five regardless of which passer rating metric we use.
Here are the quarterbacks with the biggest positive difference between their actual and adjusted quarterback rating during the 2017 season:
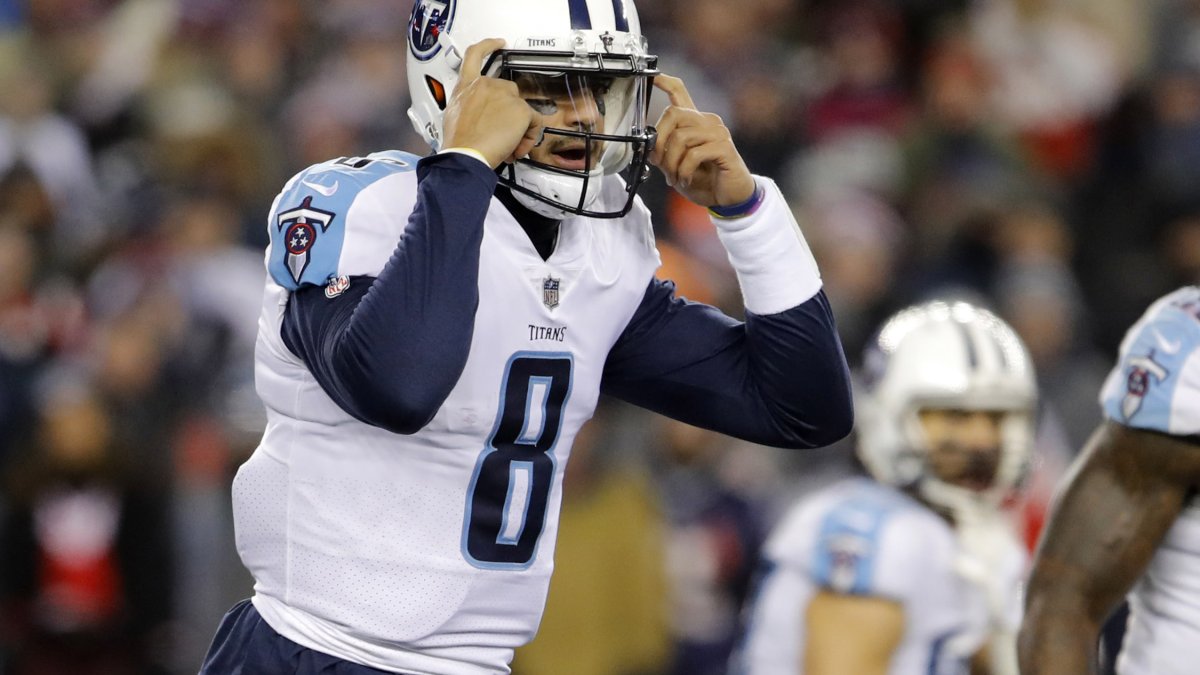
1. Marcus Mariota – 79.3 passer rating | 92.9 adj. passer rating [+13.6]
2. Tom Savage – 71.4 passer rating | 77.4 adj. passer rating [+6.0]
3. Matt Ryan – 91.4 passer rating | 96.9 adj. passer rating [+5.5]
4. Trevor Siemian – 73.3 passer rating | 77.4 adj. passer rating [+4.1]
5. Mitchell Trubisky – 77.5 passer rating | 81.0 adj. passer rating [+3.5]
Ryan led the NFL with eight throws that were picked off despite not earning a turnover-worthy grade. Siemian had seven such throws while Mariota had five. Mariota was the only quarterback with more than 10 touchdowns to have more than double that number of big-time throws.
Here are the quarterbacks with the biggest negative difference between their actual and adjusted quarterback rating during the 2017 season:
1. Brock Osweiler – 72.5 passer rating | 59.0 adj. passer rating [-13.5]
2. Aaron Rodgers – 97.2 passer rating | 85.0 adj. passer rating [-12.2]
3. Jay Cutler – 80.8 passer rating | 69.7 adj. passer rating [-11.1]
4. Blaine Gabbert – 71.9 passer rating | 61.7 adj. passer rating [-10.2]
5. Josh McCown – 94.5 passer rating | 84.6 adj. passer rating [-9.9]
Rodgers played far less than a full season but still benefitted from some good interception luck, he had only one pass intercepted that was not given a turnover-worthy grade. Osweiler didn’t have a single one of his non-turnover-worthy throws intercepted which explains his massive drop-off.
As we asked with sacks, why do we care about touchdowns and interceptions? Besides old habits dying hard, touchdowns and interceptions are indeed more valuable to the team earning them than big-time throws and turnover-worthy passes are. From 2014 to 2017, touchdowns added, on average, 3.74 expected points added (EPA) to an offense, while BTT’s offered only 2.25. Interceptions cost an offense an average of 4.65 EPA during that same stretch, while TWT cost them just 2.55.
So, much like with sacks, touchdowns and interceptions tell you what happened, while BTT and TWT tell you more about how good a player is (and likely will be in the future).


 © 2025 PFF - all rights reserved.