The season has come to a close for most NFL teams, and now is the time of reflection and reassessment. The most impactful decision a team can make is whether a quarterback is worthy of drafting, especially in the first round. Not all first-round quarterbacks are handed the reins, but the vast majority of the time for teams, there is at least a few years between first-round quarterback picks. The fates of the general manager and coach can often hinge on the success of a single selection.
In the 2019 draft, three quarterbacks were selected in the first round: Heisman Trophy winner Kyler Murray at first overall, Daniel Jones at No. 6 and Dwayne Haskins at No. 15.
While we don’t know everything about a young quarterback after just his rookie season, we do at least know some things. There are always outliers who play poorly and then turn things around; there are also those who have record-breaking rookie seasons to flame out thereafter. The larger landscape of rookie performance shows a clear bias toward those who start strongly to become the franchise quarterback teams need to succeed.
In this analysis, I’m going to go through the grades and dropback efficiency for 2019 rookie quarterbacks with at least 200 dropbacks: Murray, Jones, Haskins and sixth-round selection Gardner Minshew. We’ll form forecasts for their true passing ability in terms of grades and expected points added (EPA), properly weighing results based on the sample size of dropbacks and priors, or pre-NFL expectations, based on their respective draft positions. The technique used is called Bayesian updating. I laid out a more detailed explanation about the methodology behind this analysis in a previous article when I applied it to the 2017 quarterback class.
Bayesian Grade Forecasts
PFF famously grades every player on every play. These play-by-play grades are the foundation of the first section of the rookie quarterback forecasts.
Applying Bayesian updating to each dropback for all of the 2019 rookies gives us a “best guess” forecast for true passing grade for each quarterback, along with ranges of outcomes that reflect the confidence we should have in our assessments.
The plot below shows the progression of the passing grade Bayesian forecast for every rookie quarterback from 2007-2019 with at least 200 dropbacks. The members of the 2019 class are highlighted, with prior rookies represented by the gray lines in the background.
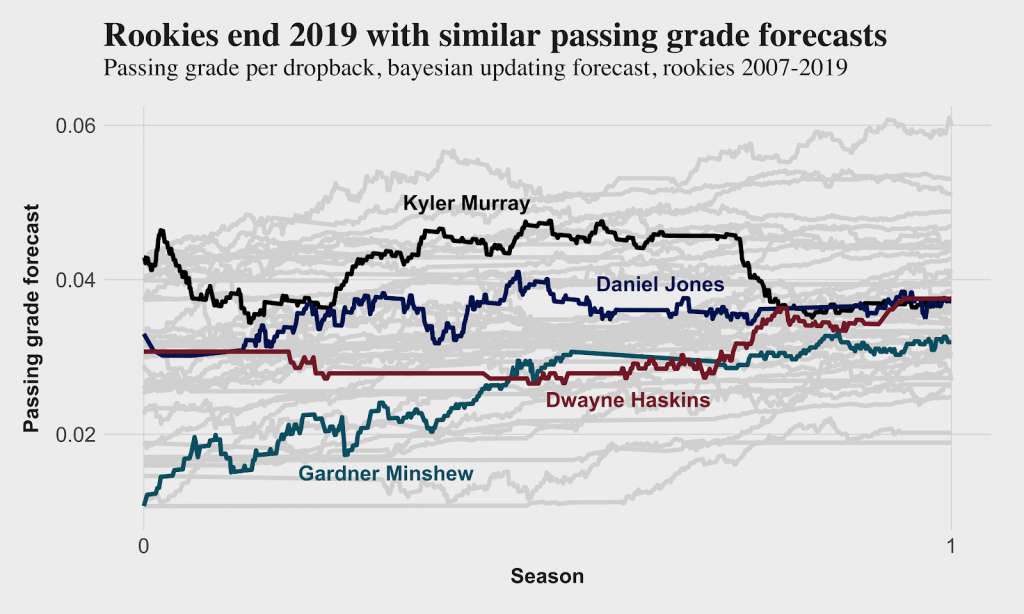
First, you’ll notice that Murray’s forecast starts higher than the rest, as No. 1 overall picks typically have better careers than quarterbacks taken lower in the draft, even those in the top half of the first round like Jones and Haskins.
Our single-season grades, which don’t account for draft position prior or dropback volume, had Minshew as the best rookie quarterback of the class (70.0). My analysis is less optimistic about his future, starting him from a lower base due to his poor draft pedigree as a sixth-round pick. Minshew’s rookie performance has dug his forecast out of a substantial draft-position hole, but he still trails the first-round picks who had lower passing grades as rookies.
Haskins had the second-best grade of the group (67.6). His Bayesian forecast doesn't best his fellow first-rounders because he had fewer dropbacks (245) than both Murray (620) and Jones (527), but if Haskins continues to outperform with more volume, his forecast will separate from the others in 2020.
Bayesian Efficiency Forecasts
When we run the same analysis using passing efficiency — as measured by EPA — Murray separates himself from the other rookies. There are only a few players who had produced better forecasts at the end of their first seasons, and we’ll identify who those passers were in the next section.
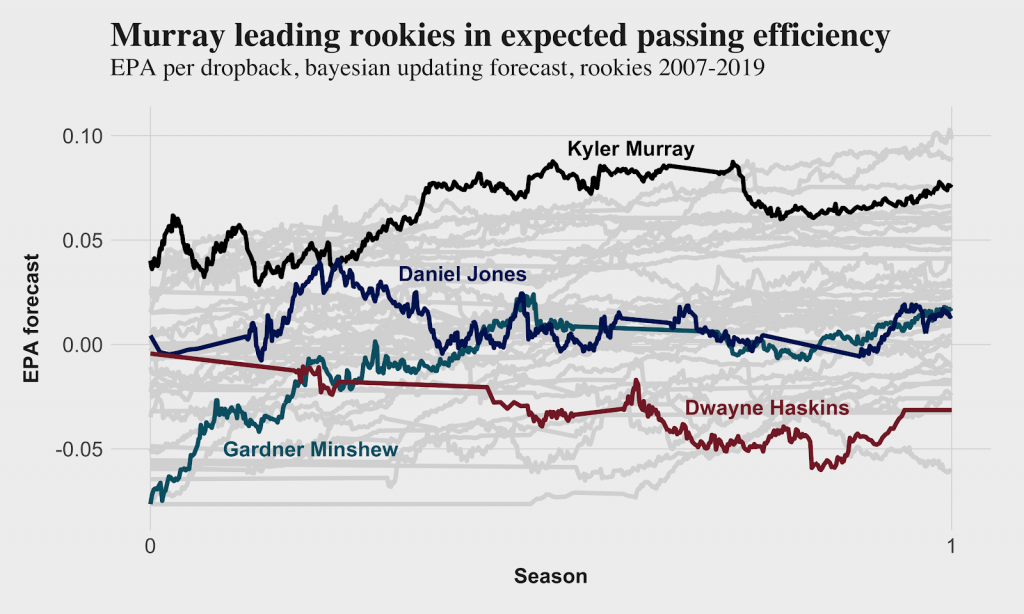
Jones struggled more as a rookie in terms of efficiency, posting the third-lowest EPA per dropback (-0.12) of any quarterback with at least 200 dropbacks (35). The least efficient quarterback this season was Haskins, and he was significantly worse than Jones (-0.24). That poor performance drove Haskins’ forecast down lower than Jones’. Jones finished the year roughly where he started, as the analysis expects rookies to perform worse in their first season than in the rest of their careers.
Minshew didn’t perform particularly well in comparison to the rest of the league, but averaging roughly an even EPA per dropback is impressive for a rookie. Minshew was slightly better than Murray this year in EPA per dropback, but Murray’s forecast is higher due to his higher draft position and having 120 more dropbacks in his sample.
An important context to keep in mind is that the projection lines in the plots above only represent the “best guess,” i.e., mean projection. We can use Bayesian updating and what we know about the variance of quarterback performance to also produce a range of outcomes for each quarterback. We still don’t know a whole lot after 200-600 NFL dropbacks.
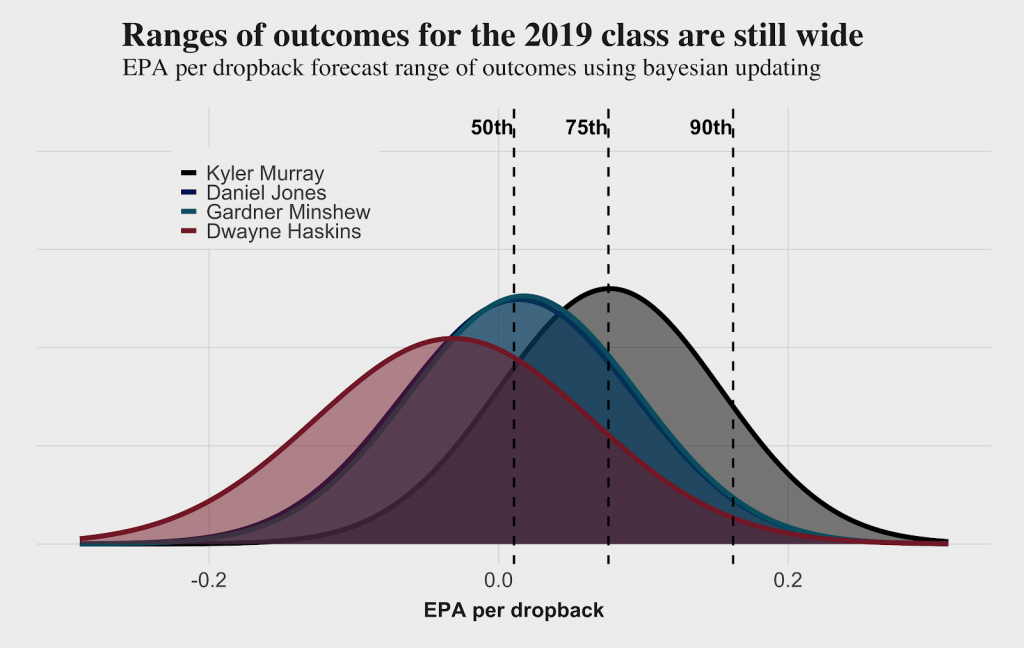
Murray’s range of outcomes based on passing efficiency according to EPA per dropback is separated from the others, but there’s still a lot of overlap between all the quarterbacks. Haskins’ range is not as tall and therefore wider than the rest because we know the least about him after having the fewest dropbacks as a rookie. It might be difficult to make out the curve for Jones and Minshew as they’re almost directly on top of each other between Murray’s and Haskins’.
Historical Perspective on the 2019 Class
We have the data for each class going back to 2007, so we can calculate the same forecasts for all rookie quarterbacks in that 13-year window. Below I’ve plotted the year-end forecasts for passing grade and EPA per dropback for each of the 45 rookie quarterbacks with at least 200 dropbacks.
The first plot highlights the 2019 class in red along with the quarterbacks who either maintained starting status beyond their rookie contracts or have yet to finish them. These are the quarterbacks whom we may call successful. The second plot shows quarterbacks who didn’t maintain starter status beyond their rookie deal, or players we would consider “failed picks.”
The Successes
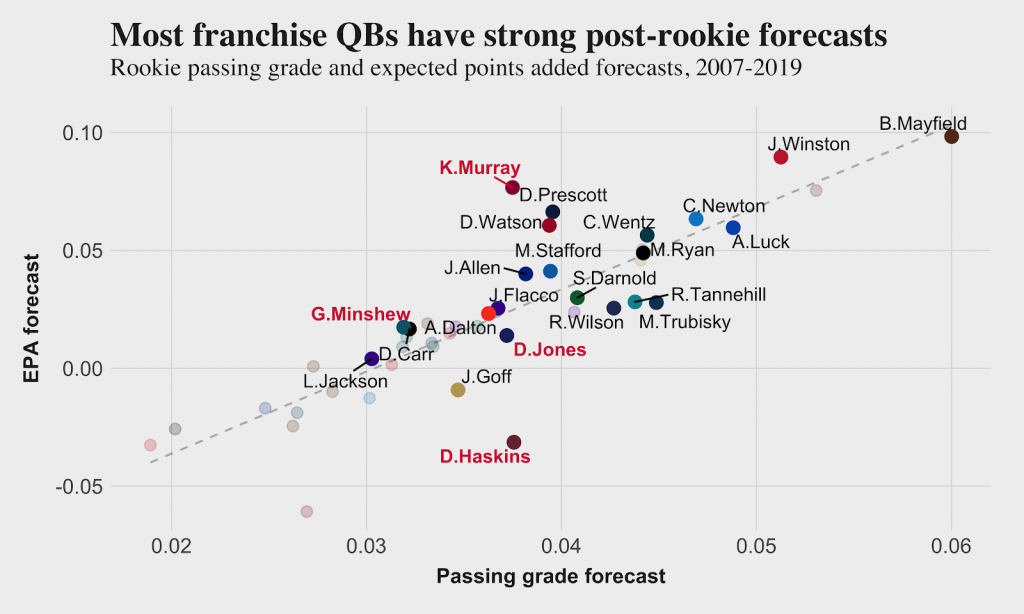
Keep in mind when viewing these results that higher-drafted quarterbacks have an advantage with their forecasts, so a very strong rookie performer like Russell Wilson won’t look nearly as strong as a weaker one like Andrew Luck due to the massive difference in draft status.
Murray is in the same area as the successes who performed better in terms of EPA than PFF grade, and those successes include Dak Prescott and Deshaun Watson. However, the landscape is a bit more troubling for Jones, Minshew and Haskins. Most of the successful rookie quarterbacks produced forecasts in the upper half of the plot post-rookie season, with Lamar Jackson, Jared Goff and Derek Carr being the only successes below Minshew and Jones. There haven’t been any successes since 2007 for rookies who performed as poorly as Haskins in terms of EPA per dropback.
The Busts
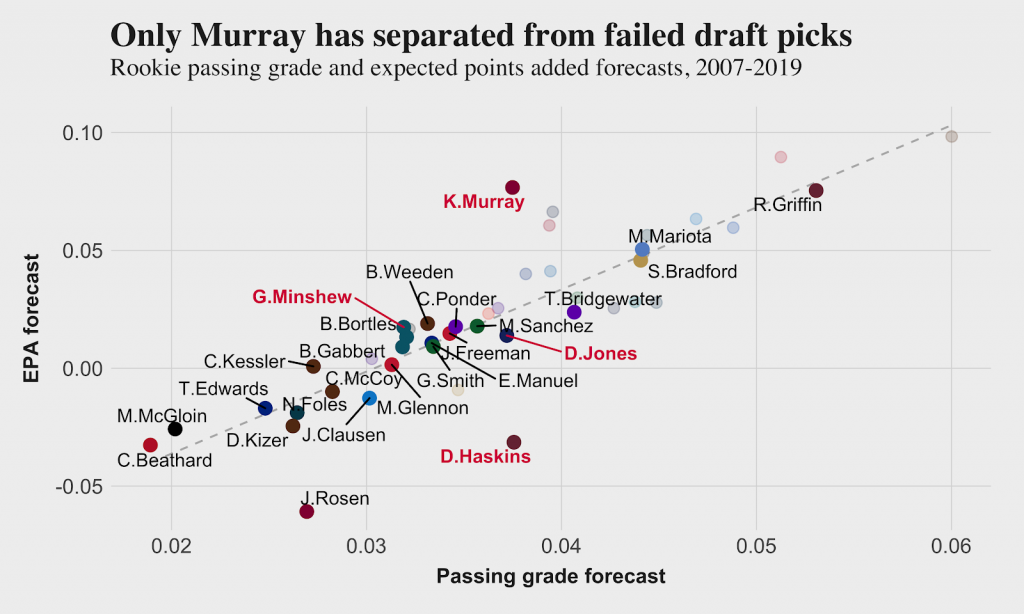
Highlighting the rookies who didn’t end up as franchise QBs shows a significant bias towards the bottom-left of the plot. Yet there are some rookies with promising beginnings who didn’t end up as successes — players like Robert Griffin III, Marcus Mariota and Sam Bradford.
Murray is largely in the clear, but the rest of the 2019 class is in the thick of bust territory. Minshew will try to avoid being part of the unholy Jaguars trinity along with prior top-10 picks Blaine Gabbert and Blake Bortles, who occupy roughly the same spot on the plot. The only quarterback worse than Haskins in terms of EPA forecast is Josh Rosen, who I’m declaring a bust already despite not having finished out his rookie deal.
Bringing Grade and EPA Forecasts Together
I found in a previous analysis that combining passing grade- and EPA-based Bayesian forecasts in roughly equal proportions can predict a quarterback’s EPA per dropback better than either alone.
The calculation is simple: normalize the two numbers into the same scale (from 0-to-100) and then average the two for a combined forecast.
| Passer | EPA | Grade | EPA + Grade | Rank (of 45) |
| Kyler Murray | 84.2 | 47.3 | 68.0 | 7 |
| Daniel Jones | 33.6 | 46.3 | 39.8 | 22 |
| Gardner Minshew | 36.6 | 29.0 | 32.7 | 28 |
| Dwayne Haskins | 7.4 | 47.6 | 22.5 | 36 |
All four of the 2019 rookies are below the 50% percentile in grade forecast, though Murray’s is roughly in the 85% percentile for EPA forecast. That gives him a combined forecast of 68 on a scale of 0-to-100, which ranks seventh of the 45 rookies since 2007 who logged at least 200 dropbacks.
Jones and Minshew are in the middle of the pack with the 22nd- and 28th-ranked forecasts, respectively. Haskins is near the bottom of the pack with the 36th-ranked forecast.
It’s too early to say that Haskins isn’t going to be a success, but the Redskins should be looking at his performance closely this coming season. Making a move too early is better than too late, just ask the Cardinals’ brass, who gave an early hook to Josh Rosen after he produced the second-worst post-rookie forecast since 2007.


 © 2025 PFF - all rights reserved.