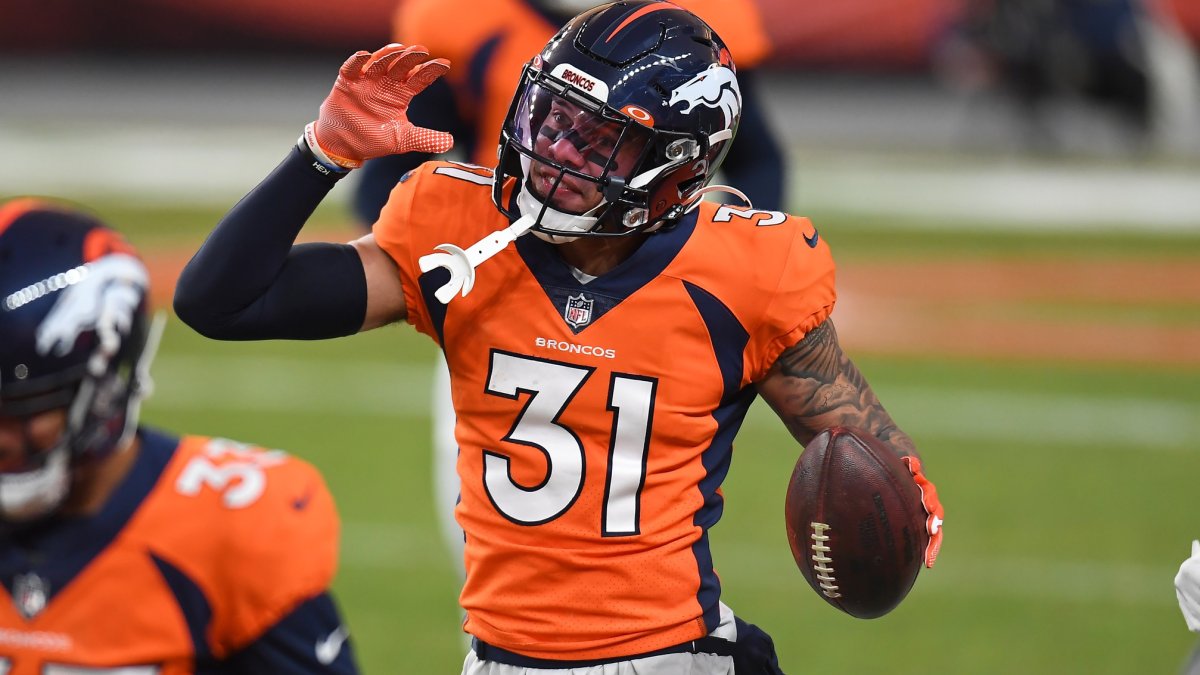
With only two teams remaining to compete in the Super Bowl, the offseason is in full swing for the rest of the NFL and football pundits. We at PFF are also getting into the action with the launch of our 2021 Draft Guide and Free Agency Rankings tool, which allows you to sort by position and team needs and includes contract projections from Over the Cap as well as historical grades and wins above replacement (WAR) numbers for the past three seasons.
This article is part of a series going through our top-ranked free agents (excluding QBs) by position group, using their past stats to match them with historical players. We started with one of the strongest free agent wide receiver classes ever, and this article turns to free agent safeties.
Once we have a sample of similar players, we can see how those similar players performed in subsequent seasons to get an idea of the current player’s range of outcomes. I’ll also include any potential bargain free agents who aren’t at the top of our rankings but look better than expected in WAR projections.
A safety’s WAR is largely based on coverage grade, which is more volatile than grading on other facets. In turn, the WAR projections for safeties in this analysis have dramatic differences in expected and ceiling projections, in addition to particularly low floors. Safeties provide outsized WAR for their relatively low cost in free agency, and both conditions are factored into this analysis.
This system is similar to FiveThirtyEight’s CARMELO NBA player projections, except that it is applied to football and uses PFF’s WAR metric as the proxy for player value.
Buying wins in free agency is an expensive proposition, but the value of each incremental win for a playoff-caliber team cannot be understated. This year, teams are going to have tough decisions on how to spend that money.
METHODOLOGY
For each of the safeties below, the closest comparable players were found by measuring the similarity between them based on several features — age (within one year), weight, WAR, previous-year WAR, WAR per snap and PFF run-defense and coverage grades and usage in the slot or outside.
The most similar players across these metrics are grouped together to calculate the expected WAR numbers for 2020 and 2021, with the weight of each comp reflecting the level of similarity. I didn’t use the same number of comps for all players, as it is more difficult to find a wide range of comparable seasons for older players.
The first plot shows the relevant WAR numbers for each of the safety’s closest comps. The next displays past and future performance for the free agent based on the comps. And the final table shows the dollar values based on positional WAR baselines for each outcome (expected, ceiling and floor) through 2022.
I decided to restrict the forecasts to the next two years to maximize the number of comparable players we have in the dataset, reduce error for longer forecasts and reflect the fact that all but the top-tier free agent contracts in the NFL are glorified two-year deals that give teams the option to continue.
No. 6: Justin Simmons
Exclusive content for premium subscribers

WANT TO KEEP READING?
Dominate Fantasy Football & Betting with AI-Powered Data & Tools Trusted By All 32 Teams
Already have a subscription? Log in


 © 2025 PFF - all rights reserved.