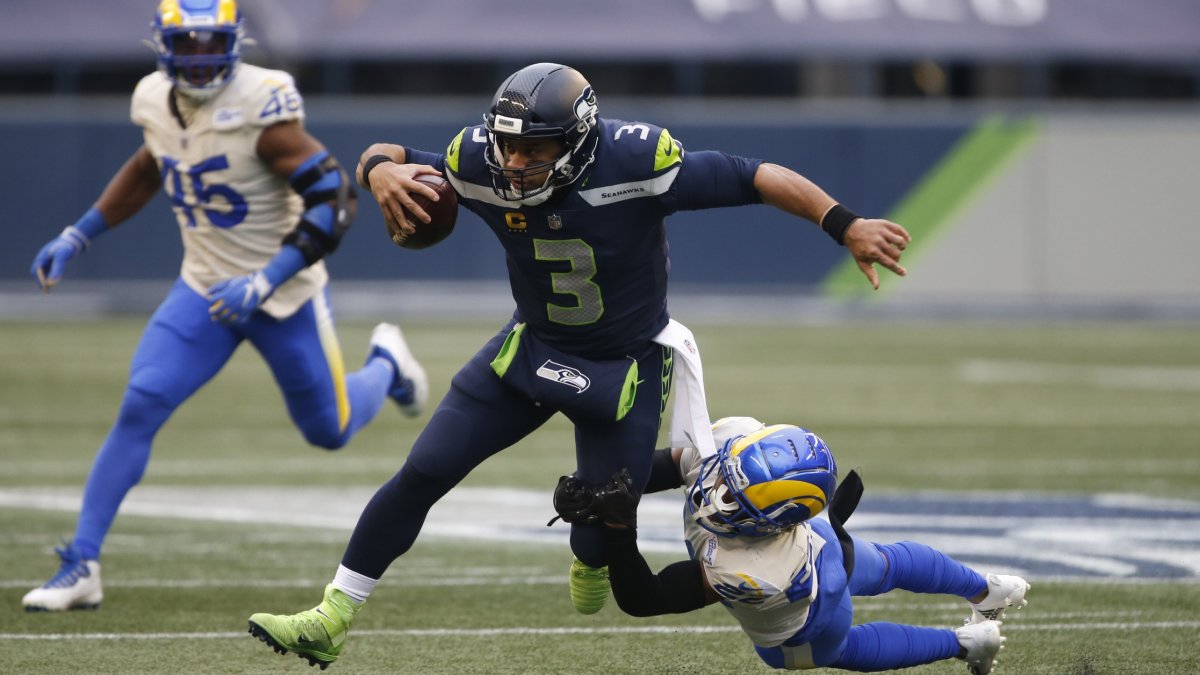
Seattle Seahawks quarterback Russell Wilson made it clear this offseason he’s tired of getting hit. Since entering the NFL in 2012, Wilson has been sacked and pressured more frequently than any other quarterback.
Here at PFF, we would be quick to point out that quarterbacks control their pressure rates largely by deciding when to get rid of the football. Wilson’s average time to throw ties for the second-longest in the NFL since 2012, which might explain his league-leading 41% pressure rate in that span. Stopping the analysis there, however, neglects much of the nuance behind a quarterback's decision to hold onto the ball.
Think of a quarterback as a gambler. At any given moment during a dropback, they can either throw the ball, realizing the expectation of what routes are available then and there, or wait for a bigger opportunity to develop downfield at the risk of taking a sack. It’s a bet on whether the offensive line can hold up longer than the defense’s coverage, or on the quarterback’s own athleticism and ability to create new openings before the pass rush arrives.
“Sometimes you hold on to it a little bit, you know, just because you're looking for that play and you find those guys,” Wilson explained on the Dan Patrick Show in February. “But also, so many of those times those turn into touchdowns.”
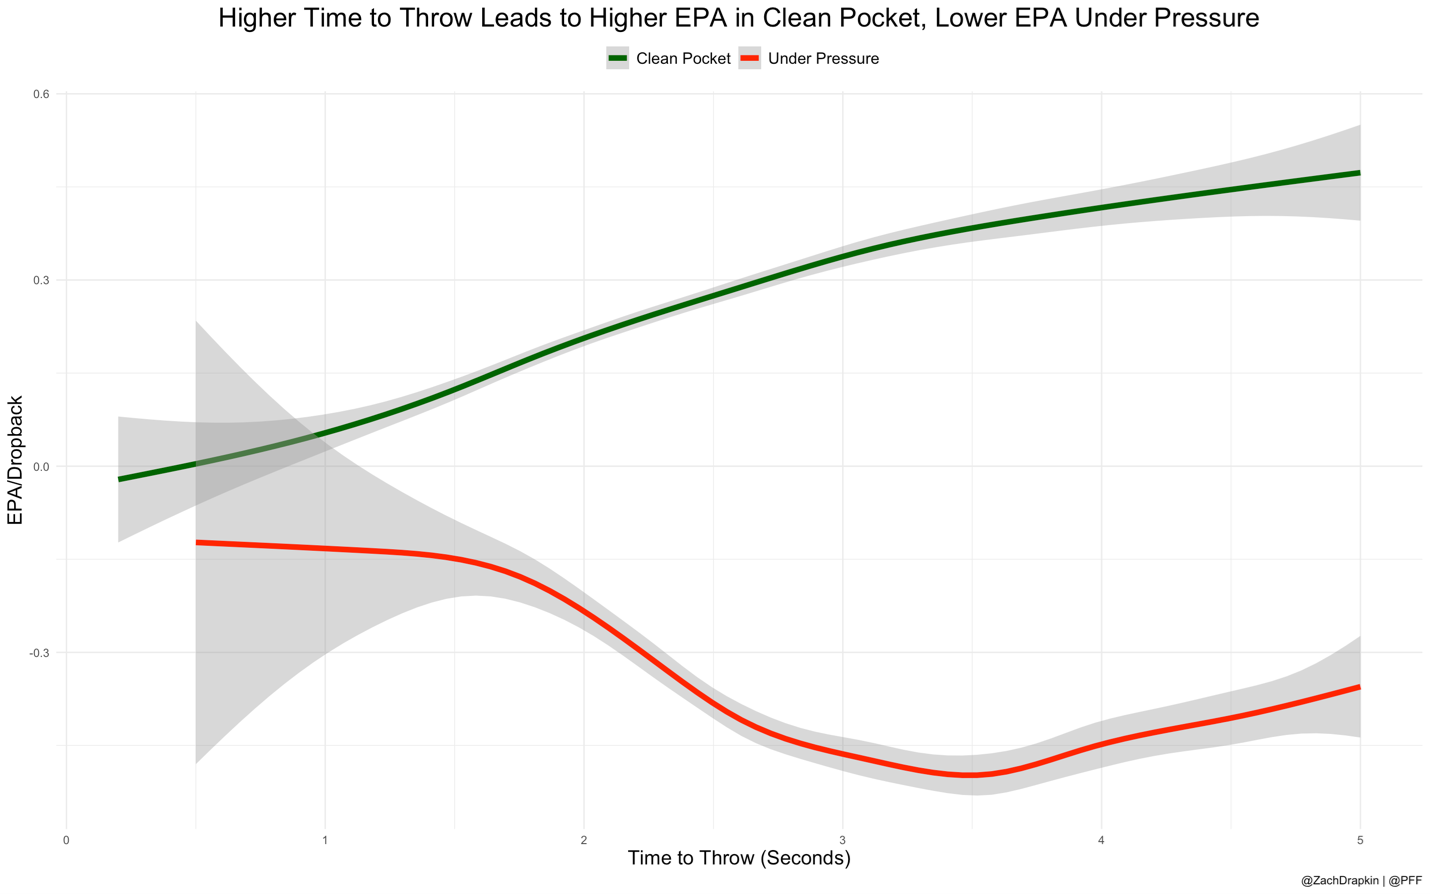
In a clean pocket, a longer time to throw is associated with higher expected points added (EPA — a statistic that measures the value of a play, explained here and here), as routes downfield get more time to develop. The incentive to gamble is clear. But holding onto the ball when under pressure doesn’t yield the same return. Allowing more time for the play to develop improves the gamble Wilson is making for the team, but continuing to hold onto the ball when faced with pressure only worsens the potential outcomes.

Introducing Time Since Pressure
That’s where time since pressure (TSP) comes in. Rather than measure a quarterback’s propensity to hold onto the ball on all plays, time since pressure tracks only how long the quarterback holds it once he comes under pressure. Time since pressure captures not whether a quarterback invites pressure — though both TSP and time to throw are correlated with pressure rate — but how quarterbacks behave when plays break down.
Interestingly, a quarterback’s time since pressure is more stable year-to-year (r = 0.78) than any other measure of quarterback risk tolerance, including time to throw (r = 0.75), pressure rate (r = 0.57) and sack rate (r = 0.44).
Wilson is notorious for extending plays under duress, so it should be no surprise that his average TSP of 1.38 seconds ranks sixth-highest among quarterbacks with at least 1,000 dropbacks since 2011. On the opposite end of the spectrum, Peyton Manning had the lowest average TSP during that span — at 0.52 seconds.
On the surface, this information doesn’t explain why certain quarterbacks hold onto the ball longer than others. There isn’t a strong linear relationship between TSP and EPA at the play level, though we see EPA per play bottom out around one second after pressure. If a quarterback can evade pressure for at least one second, the play’s expectation tends to increase from that point on. And that hints at which players tend to remain composed in the face of pressure.
Exclusive content for premium subscribers

WANT TO KEEP READING?
Dominate Fantasy Football & Betting with AI-Powered Data & Tools Trusted By All 32 Teams
Already have a subscription? Log in


 © 2025 PFF - all rights reserved.