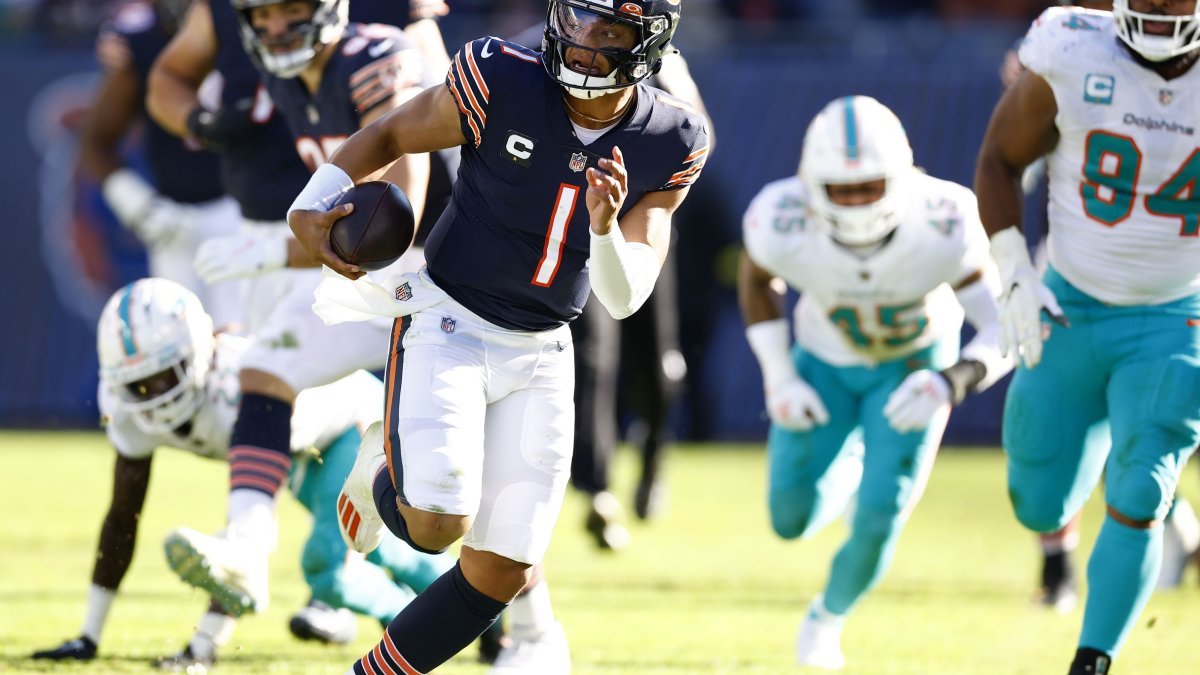
The salary cap for the 2023 season is set at $224.8 million, representing a near-$20 million increase over the 2022 season.
Here is how all 32 NFL teams currently stand, keeping in mind that cap space is a constantly changing number as teams maneuver throughout the offseason. Salary sap data comes courtesy of our friends at OverTheCap.
Last updated: Monday, March 20, 8:45 pm EST
CLICK HERE TO SEE 2023 FREE-AGENCY GRADES FOR ALL 32 TEAMS
| Rank | Team | Cap Space | Effective Cap Space | Active Cap Spending | Dead Money |
| 1 | Bears | $41,404,518 | $36,076,731 | $167,215,926 | $22,968,812 |
| 2 | Texans | $25,702,035 | $14,549,889 | $174,645,704 | $30,222,736 |
| 3 | Falcons | $24,155,594 | $19,019,694 | $188,780,350 | $16,586,001 |
| 4 | Cardinals | $24,056,888 | $15,991,807 | $192,670,081 | $11,722,972 |
| 5 | Packers | $23,732,269 | $19,845,887 | $185,372,895 | $16,809,087 |
| 6 | Panthers | $22,687,680 | $14,414,483 | $163,706,444 | $50,908,208 |
| 7 | Lions | $22,358,534 | $14,018,057 | $193,745,349 | $10,256,219 |
| 8 | Colts | $20,313,924 | $12,655,977 | $187,766,531 | $23,242,320 |
| 9 | Raiders | $18,861,789 | $12,685,078 | $185,227,380 | $30,062,499 |
| 10 | Bengals | $17,446,885 | $14,822,214 | $207,719,247 | $593,004 |
| 11 | Saints | $16,495,476 | $13,279,823 | $183,958,116 | $22,857,975 |
| 12 | Chargers | $16,106,709 | $13,056,591 | $207,378,728 | $2,185,929 |
| 13 | Steelers | $13,952,485 | $9,577,543 | $203,146,246 | $11,278,814 |
| 14 | Patriots | $13,133,399 | $8,915,028 | $191,818,533 | $16,578,716 |
| 15 | Seahawks | $11,908,554 | $2,243,214 | $193,207,171 | $16,139,165 |
| 16 | Jets | $11,280,511 | $7,216,794 | $210,333,830 | $6,116,769 |
| 17 | Browns | $10,392,926 | $8,645,361 | $230,157,346 | $10,371,962 |
| 18 | Titans | $10,099,710 | $5,715,215 | $183,135,437 | $36,814,287 |
| 19 | Cowboys | $9,826,558 | $7,056,501 | $210,784,055 | $8,878,623 |
| 20 | Chiefs | $9,551,215 | $6,845,175 | $202,273,550 | $7,773,428 |
| 21 | Bills | $9,503,791 | $6,743,224 | $212,179,654 | $5,213,000 |
| 22 | Broncos | $8,499,851 | $7,513,684 | $215,968,534 | $7,585,866 |
| 23 | Rams | $8,407,748 | $1,167,273 | $162,837,569 | $52,773,395 |
| 24 | 49ers | $7,964,688 | $6,916,959 | $211,619,992 | $17,085,988 |
| 25 | Ravens | $7,449,435 | $4,933,018 | $204,685,142 | $10,627,708 |
| 26 | Dolphins | $6,036,393 | $5,139,633 | $215,326,201 | $3,499,401 |
| 27 | Jaguars | $4,402,027 | $1,290,799 | $216,064,193 | $5,411,497 |
| 28 | Giants | $3,832,171 | $879,048 | $202,254,978 | $22,739,609 |
| 29 | Commanders | $3,715,885 | $185,080 | $207,698,258 | $18,988,157 |
| 30 | Eagles | $1,876,177 | ($3,642,179) | $177,229,733 | $54,729,912 |
| 31 | Buccaneers | ($578,709) | ($3,803,225) | $152,595,220 | $74,566,702 |
| 32 | Vikings | ($8,980,189) | ($11,432,417) | $202,804,931 | $27,022,661 |
*Represents the maximum cap space a team will have when it signs at least 51 players to its roster for that season.


 © 2025 PFF - all rights reserved.