“Running backs don't matter” is an all-too-familiar adage in the NFL analytics landscape. There are a few variations to the phrase, but the basic argument is that rushing attempts don't impact a passing attack's efficiency, and running back production isn't stable from season to season.
The 2019 Big Data Bowl — an NFL-hosted data science competition where participants were tasked with predicting how many yards a given rushing play would result in — focused on the “running backs don't matter” argument, ultimately producing a model used by the NFL's Next Gen Stats.
But Michael Lopez, the NFL’s director of football data and analytics, has examined the model’s stability, concluding that running back performance is actually stable and hence may matter to some extent.
Here, we’ll look at Lopez’s findings by constructing an expected rushing yards model using PFF data. To reproduce the NGS-driven model, we’ll use PFF presnap position charting data instead of NGS player tracking data — the latter of which is unsurprisingly better for this purpose.
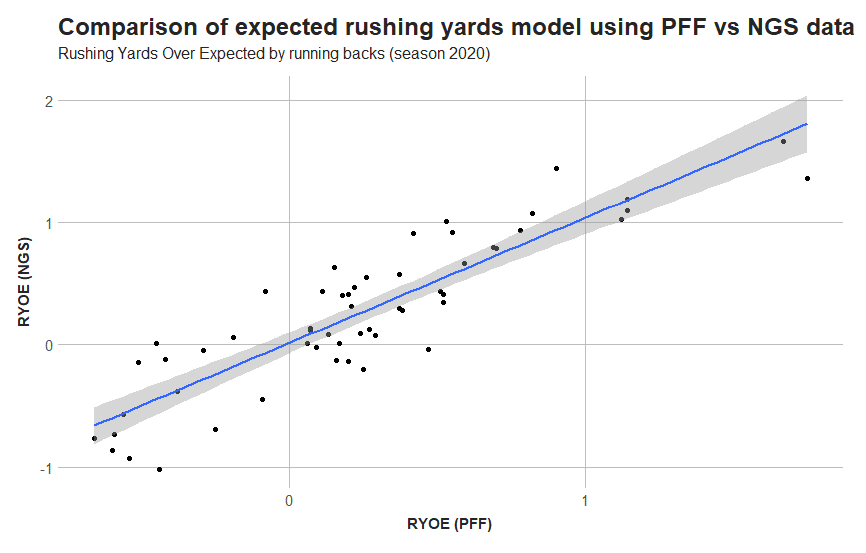
When comparing the models, we observe that running backs with higher carry numbers don't have seasonal expected yards averages that differ much from the league average. As a result, aggregate metrics like rushing yards over expectation (RYOE) turn out to be similar. And as shown below, the RYOE for the two models are highly correlated:
We can also look at some specific plays to examine the ability of the PFF model. The play below had the most expected rushing yards of any run during the 2020 NFL season.
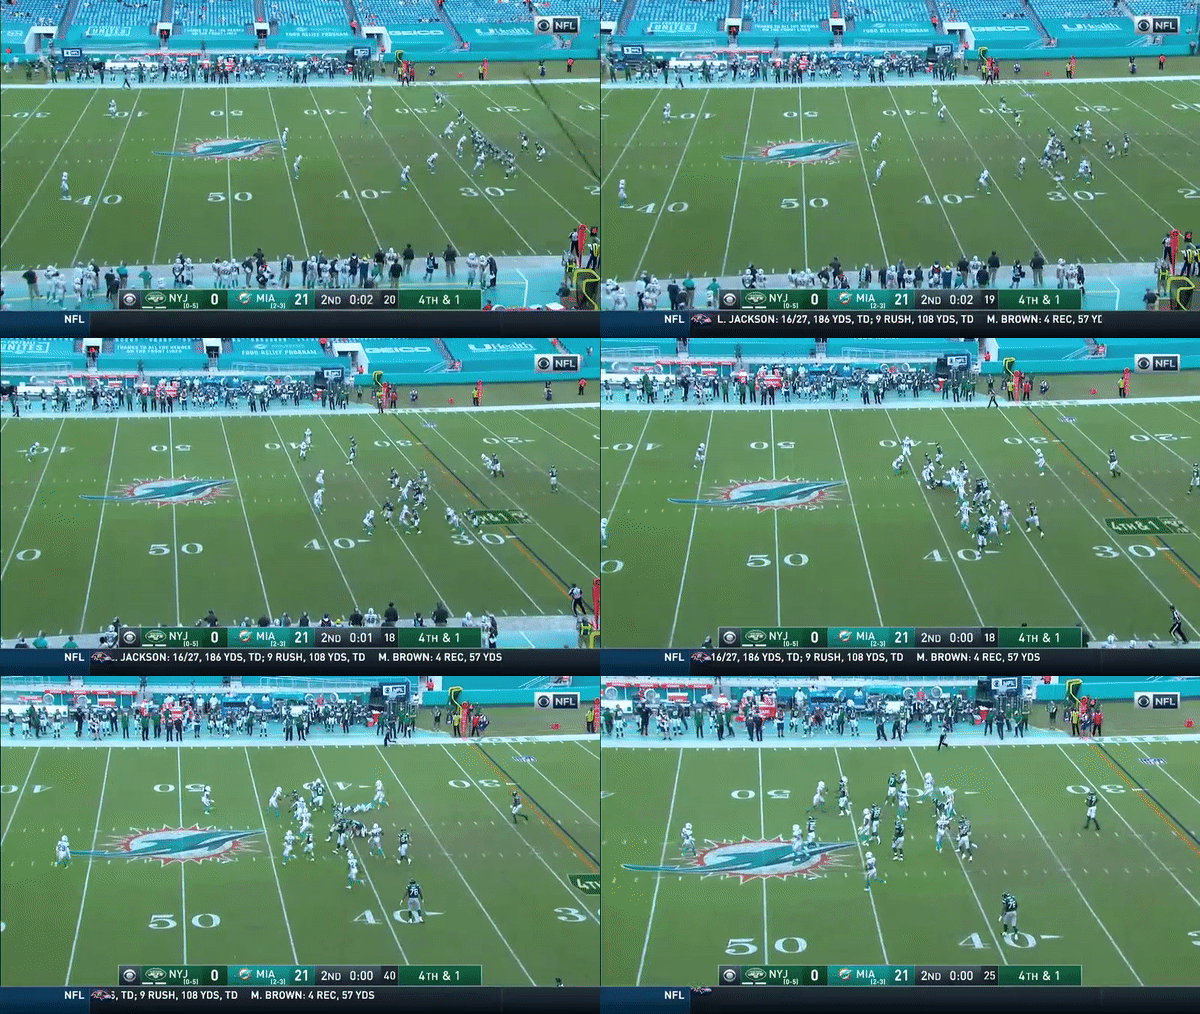
There are only two seconds left in the first half, so the Miami Dolphins are in a prevent defense — hence why the rush is expected to gain 15.3 yards.
And on the other end of the spectrum, here is the non-quarterback sneak play with the lowest expected rushing yards from the 2020 campaign.
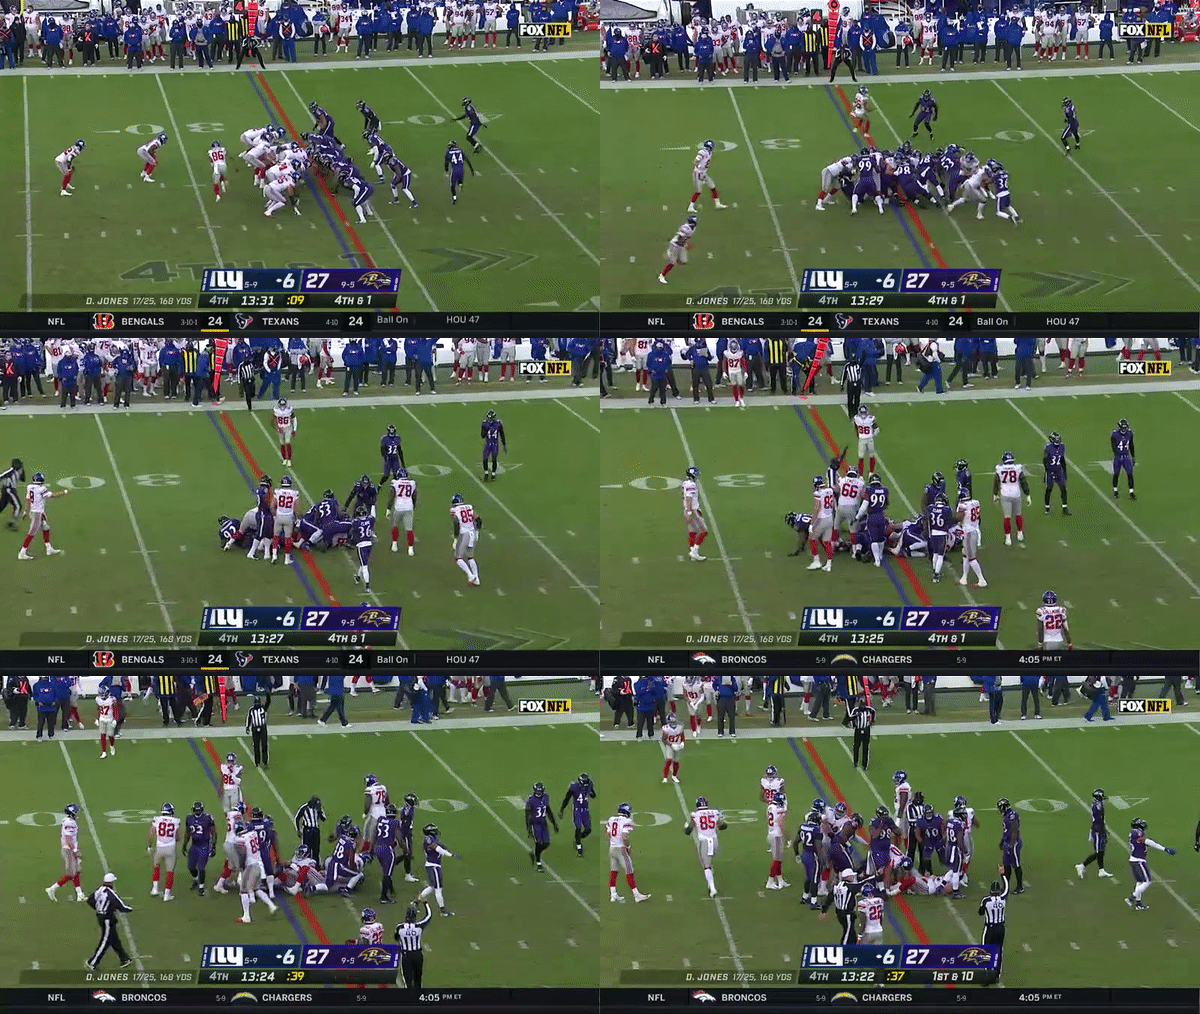
With one yard to go on fourth down, the Baltimore Ravens pack the box to stop the run, resulting in an expected -0.97 yards for the attempt.
These two plays show the PFF model is capable of determining rushing yards based on where players are aligned before the snap.
To inspect the stability of our expected rushing yards model, year-to-year correlation coefficients are calculated for running backs who have 50 or more carries in a season, and each season is simulated 100 times. Here is the result:
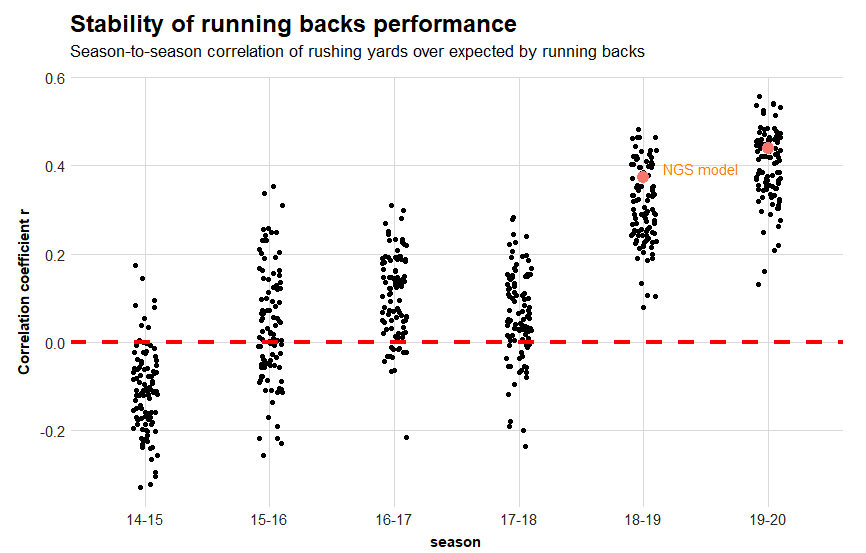
We see that the NFL NGS model, indicated by the orange dots within the clusters, has near-average seasonal stability within our bootstrapped seasons. This indicates that the NGS models are likely slightly better than PFF’s model at predicting running back performance over the past two seasons.
The NFL’s tracking data system underwent an upgrade during the 2018 season, which increased accuracy. But PFF’s underlying data collection process has remained the same, so the increase in running back performance stability is likely due to a change in the league environment.
For example, here are the top 15 players in rushing yards over expectation (RYOE) for the 2019 and 2020 seasons, according to NFL Next Gen Stats.
| Player (2019) | RYOE per att. (2019) | Player (2020) | RYOE per att. (2020) |
| Derrick Henry | 1.06 | Nick Chubb | 1.75 |
| Tony Pollard | 1.05 | J.K. Dobbins | 1.67 |
| Nick Chubb | 0.92 | Gus Edwards | 1.14 |
| Josh Jacobs | 0.87 | Ronald Jones | 1.14 |
| Christian McCaffrey | 0.75 | Derrick Henry | 1.12 |
| Damien Williams | 0.75 | Aaron Jones | 0.90 |
| Alexander Mattison | 0.67 | Dalvin Cook | 0.82 |
| Saquon Barkley | 0.63 | Jonathan Taylor | 0.78 |
| Gus Edwards | 0.57 | Wayne Gallman | 0.70 |
| Chris Carson | 0.57 | Raheem Mostert | 0.69 |
| Raheem Mostert | 0.55 | Jeffery Wilson | 0.59 |
| Benny Snell | 0.51 | Alvin Kamara | 0.55 |
| Mark Ingram II | 0.51 | Damien Harris | 0.53 |
| Carlos Hyde | 0.48 | David Johnson | 0.52 |
| Leonard Fournette | 0.46 | Devontae Booker | 0.52 |
As we observe, there is some overlap of players within those two seasons. The Tennessee Titans, Cleveland Browns, San Francisco 49ers and Baltimore Ravens — not to mention the Minnesota Vikings, as Dalvin Cook ranked 16th in 2019 — all had top-rated running backs and used play action often in their schemes.
So, when we ask if running backs matter, we need to look at how a team’s offensive scheme and quarterback elevate their running backs’ performances. For example, the Ravens essentially replaced Mark Ingram II with J.K. Dobbins in 2020 and were still able to maintain a productive ground game.
The two-year sample of year-to-year correlation doesn’t imply if running backs really matter; a larger sample is needed. But from the evolution of offensive schemes, we can glean a potential hint that passing scheme and quarterbacks could be the driving force behind the increase of running backs “mattering.”


 © 2025 PFF - all rights reserved.