• Unlock your edge with a PFF+ subscription: Get full access to all our in-season fantasy tools, including weekly rankings, WR/CB matchup charts, weekly projections, the Start-Sit Optimizer and more. Sign up now!
Estimated reading time: 8 minutes
Welcome to the second installment of my statistical modeling series. If you missed the first installment, you can check it out here.
This week, we're focused on refining our model using insights from personal observations and expert feedback. I received valuable input from sharp minds like PFF data scientist Timo Riske and NFL analytics pioneer Josh Hermsmeyer.
The key feedback included:
• Addressing “next week predictiveness” beyond typical regression: For example, if a player sees 25 targets in Week n, we can expect fewer targets in Week n+1 purely due to regression. The challenge is to ensure our model accounts for this in a meaningful way.
• Incorporating target depth into the model: This involves considering the depth of both predicted and actual targets.
Personal adjustments I plan to make include:
• Focusing on target shares relative to team pass attempts rather than raw target counts. This adjustment should help account for variability in game scripts and passing frequency, such as situations where teams like the Falcons throw 58 times in a game.
Before diving into these changes, it's worth noting:
• If you rely on metrics like Target Share or Air Yards Share in your analysis, what I've built using route-level PFF data is superior in every way and should command your attention.
Proving that our model is not just a typical regression
For those who may not be familiar, the term “regression” in this context simply refers to the tendency for a player's performance to move back toward their average.
This can work in either direction — positive or negative. For example, if Player X typically averages a 0.30 target share each week but drops to 0.10 in Week n, we expect them to move back toward their 0.30 average in Week n+1, assuming no significant change in their role or situation. They might even see a slight bump above 0.30 in that particular Week n+1.
One straightforward way to validate our model is to use our Share of Predicted Targets to forecast the Next-Week Target Share and then compare those predictions against standard Target Share metrics.
If our model does a better job of predicting future target shares, it clearly indicates that our approach is good.

This table offers a lot of valuable insights, so let’s break it down:
• Target Share explains 41% of the variance in Next-Week Target Share. It’s worth noting that Target Share is one of the most stable opportunity metrics in football. In the world of sports analysis, few metrics achieve an Rsq as high as 0.41.
• Our Share of Predicted Targets metric — [Predicted Targets]/[Sum of Team Predicted Targets] — explains an additional 7% of the variance compared to Actual Target Share when predicting Next-Week Actual Target Share. This improvement might sound small, but in predictive modeling, it’s a significant leap forward.
• Moreover, Share of Predicted Targets shows much greater stability than Target Share, with an improvement of 0.18 in Rsq. This means that it’s a more consistent predictor over time, offering a clearer picture of future opportunities.
Below is the same analysis with a route threshold of 15-plus routes run, which further refines the comparison.

Even after increasing our route threshold, we still see a predictiveness improvement for Week N+1 Target Share when we use our Share of Predicted Targets variable! That is incredible.
As a reminder, Share of Predicted Targets is equal to:

Share of Predicted Targets is superior to Target Share in every way!
As I was sharing the results with Timo, he said, “It being more predictive sounds natural when you consider that it carries both the information about the receiver being good or bad but also the information about the other receivers on the team not being good or bad, because bad receivers will contribute to the predicted share less.”
Adjusting for Depth of Target
While discussing with Timo, he suggested building a similar model that focuses on targeted routes to develop a “Predicted Air Yards” metric. This metric would help answer the question: “If the receiver had been targeted, how many air yards would they have gained?”
Fortunately, I didn’t have to start from scratch. I reused most of my existing code, modifying it to include only targeted routes.
Now, we have a Predicted Air Yards Model! Since this metric is numeric, we can calculate a Validated R-squared using 2023 data. Our route-level Validated R-squared is 0.23, which is strong for a play-by-play model. Typically, R-squared values improve when aggregated to the game or season level.
For those interested, here’s a look at the variable importance:
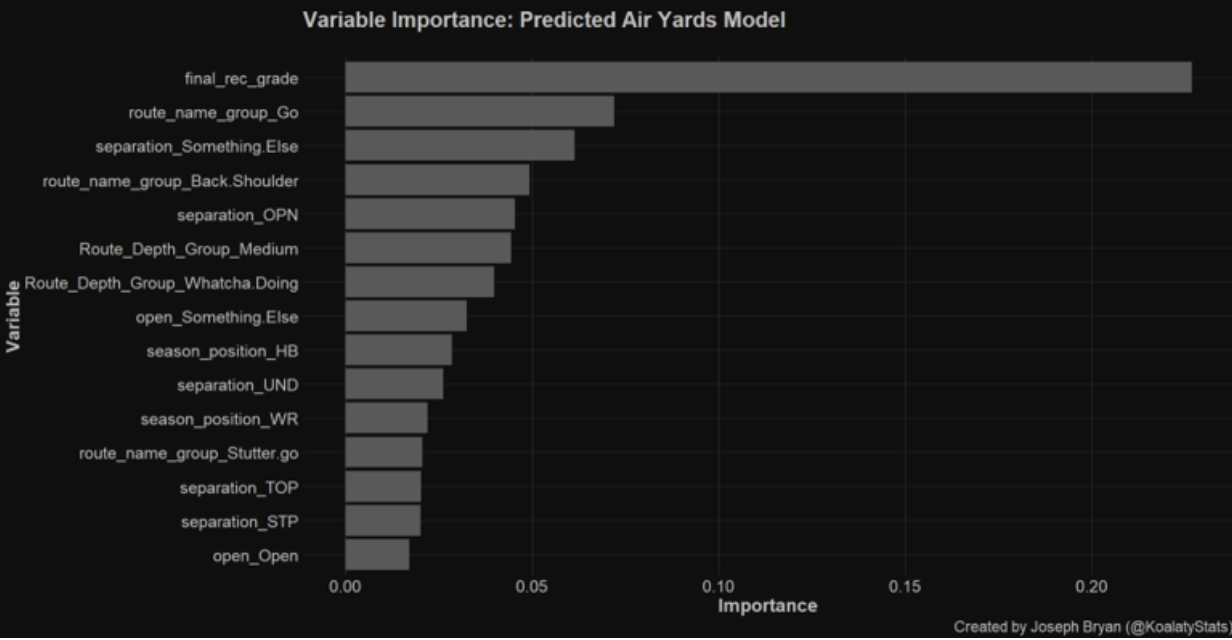
• Final_rec_grade comes out as our most important predictor, which, yet again, tells us PFF’s process is solid.
• Go routes show up at No. 2! This makes intuitive sense.
• “Something Else” for separation is a classification I made for separation that did not easily classify into “tight,” “one step,” or “open.” Most routes that fall into this are routes like back-shoulder throws, where there is not much separation.

• So, Air Yards Share can predict Next-Week Air Yards Share at .44 Rsq, which is very good and stable. As I said earlier, it does not get much better in real-life sports analytics.
•Using Share of Predicted Air Yards ([Predicted Air Yards]/[Sum of Team Predicted Air Yards]), we gain significantly more predictive power for projecting Next Week Air Yards! Plus, we achieve greater overall stability, just as we did when utilizing Share of Predicted Targets.
• Using our Predicted Air Yards model allows us to increase our predictive power of Next Week Air Yards by .1 Rsq. If you aren’t big into statistics, let me tell you — this is outstanding.

These trends generally persist when we increase our route threshold.
The stability metrics for our Share of Predicted Targets and Share of Predicted Air Yards are genuinely impressive. Each metric outperforms its “actual” counterpart in stability, better predicts the future performance of those actual counterparts, and maintains this stability even when we raise the route threshold.
Week 5 Predicted Opportunity Tables:
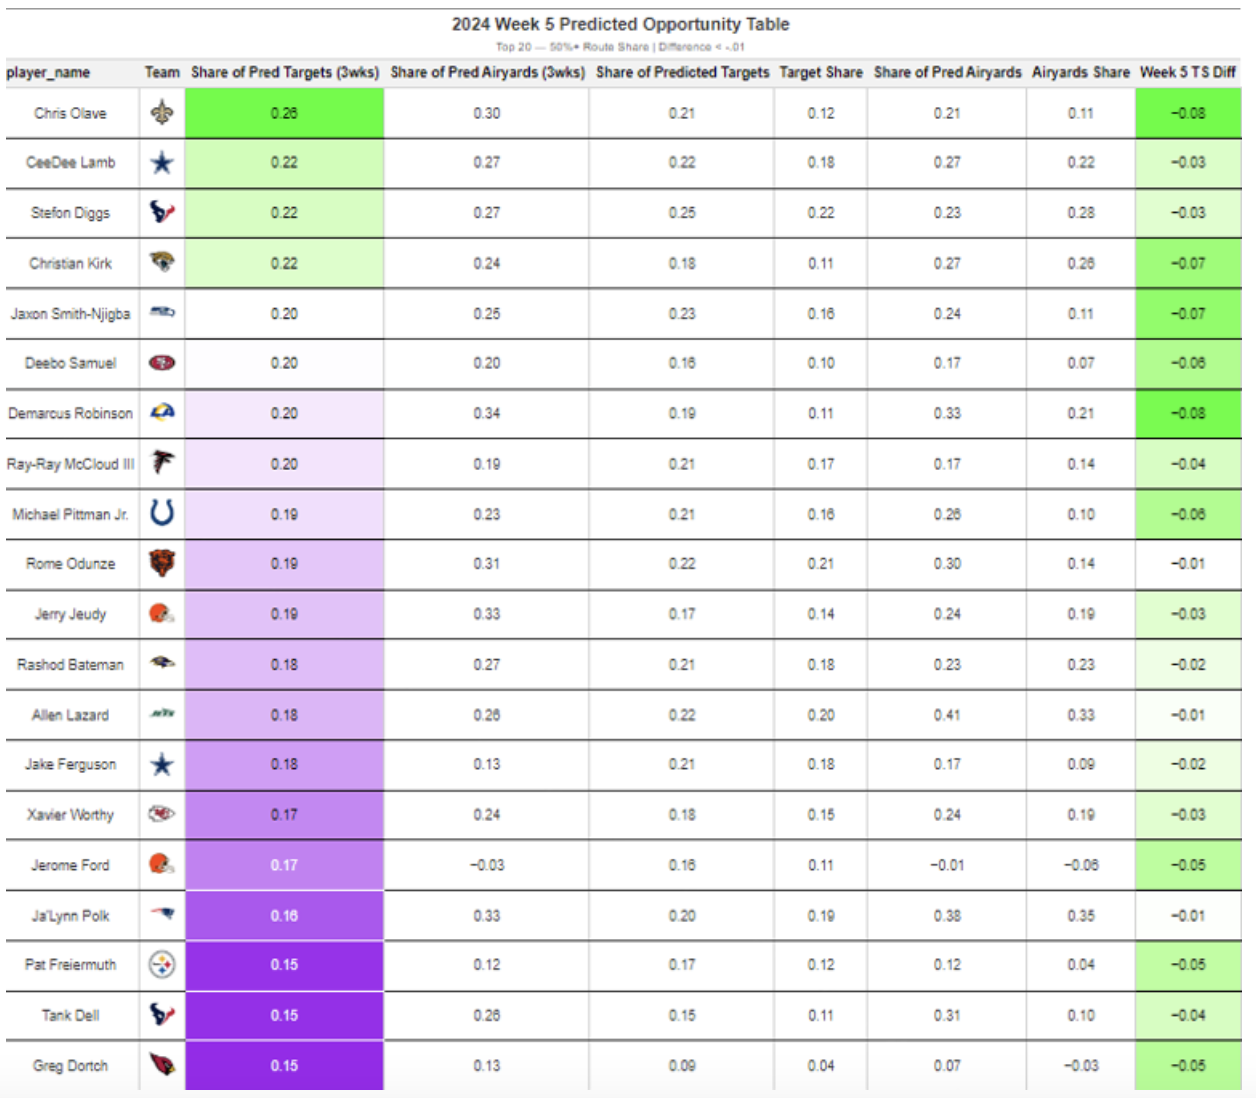
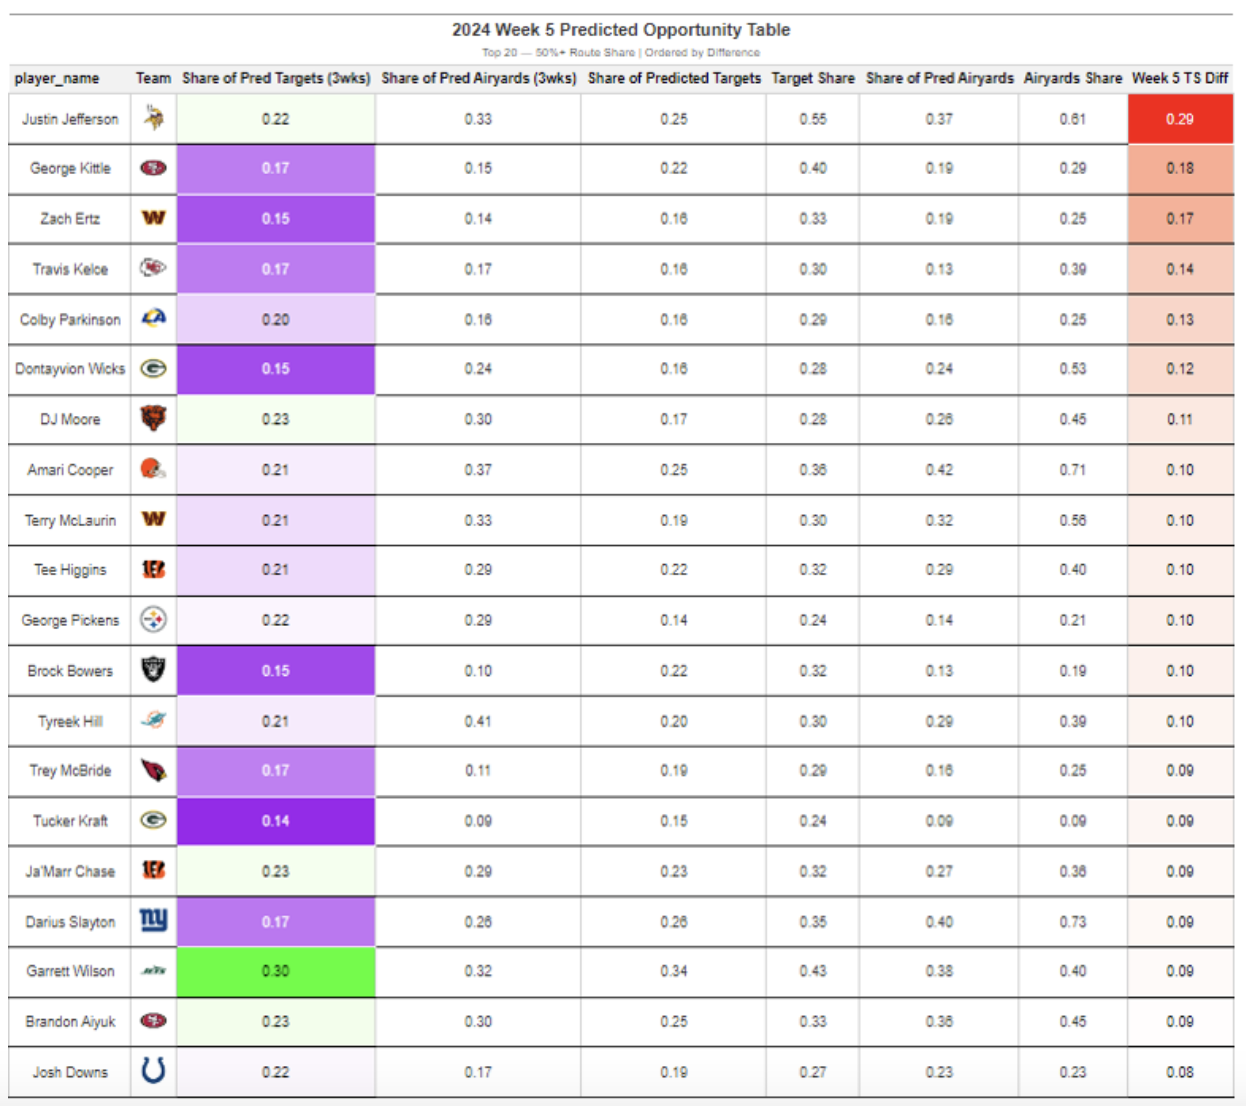
I will dive into some fantasy implications of this model in my new article, which uses it and some interesting regression analysis to predict breakouts!
Week 5 Model Review
I wanted to dig into some examples of the model in action from last week. This gives me a chance to reflect on what the model could do better and show you what it sees on a week-to-week basis.
Editor's note: All screenshots come from NFL+
WR Jalen Nailor, Minnesota Vikings: 3.4 Predicted Targets, 0 Actual Targets
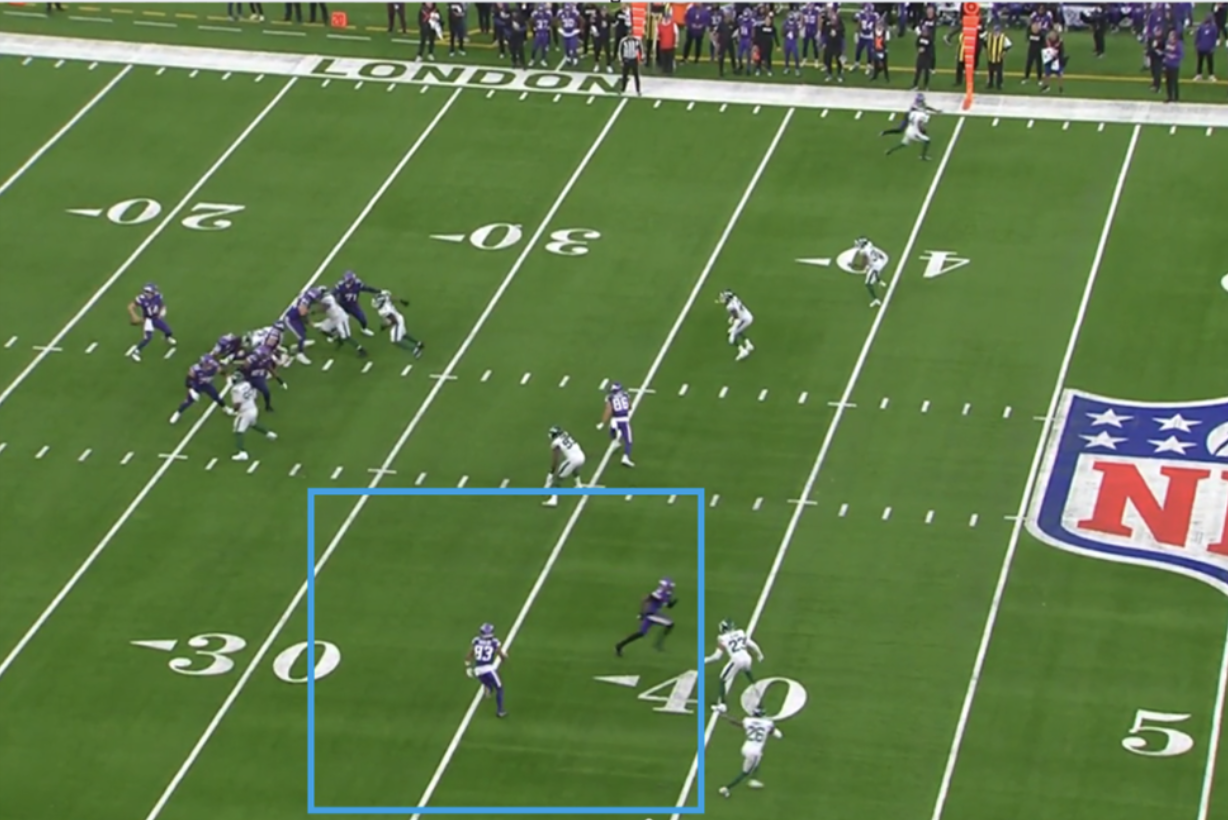
Nailor was wide open on this play, with my model showing a more than 50% likelihood of him being targeted. However, the pass ultimately went to Justin Jefferson. A pass interference penalty was called, but if it hadn’t been, the Vikings might have regretted missing the opportunity to target Nailor.
Jefferson had a significant 30% difference between his Share of Predicted Targets and Target Share, highlighting how elite players tend to draw targets even when other options are open.
It’s not necessarily a bad decision to target someone like Jefferson — his talent means he can make a play at any moment — but from a purely optimal standpoint, targeting Nailor might have been the better choice in this instance.
WR CeeDee Lamb, Dallas Cowboys: 7.7 Predicted Targets, 7 Actual Targets
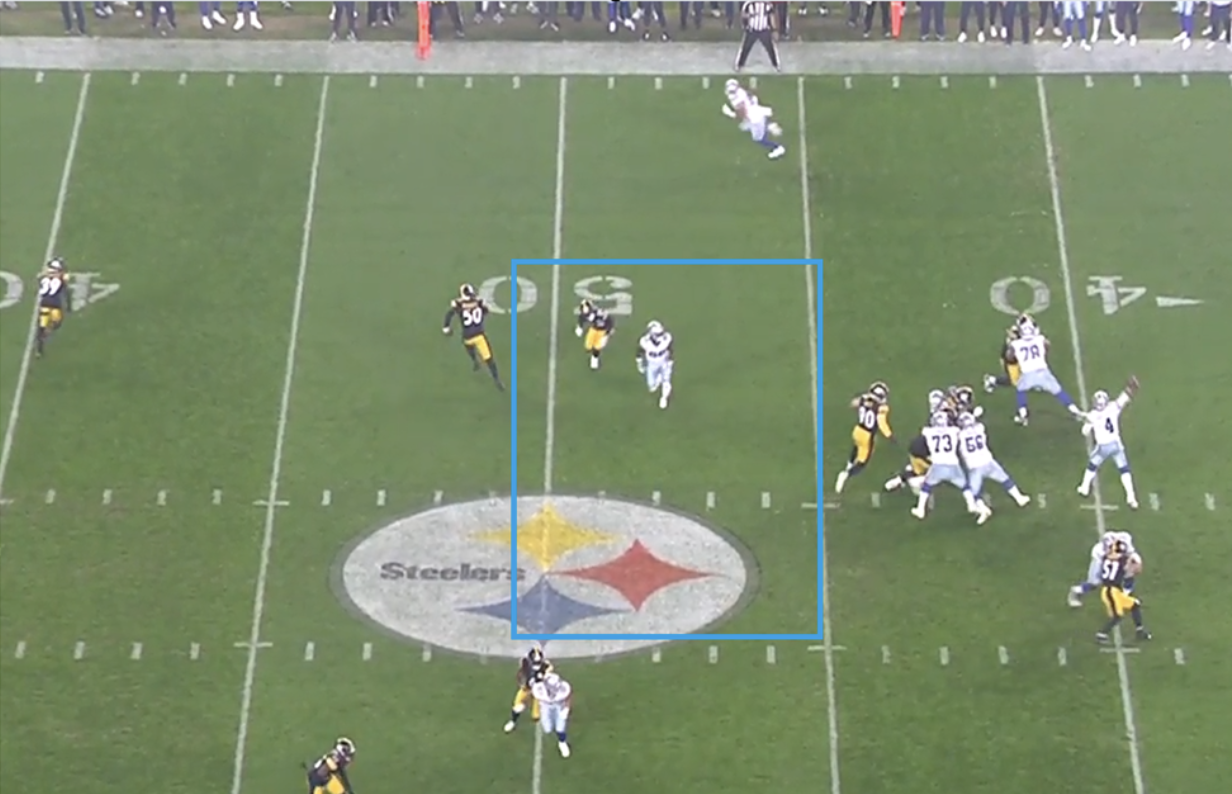
This wasn’t a bad decision by Dak Prescott at all. To be honest, I’m not sure how Brevyn Spann-Ford got that wide-open for a 13-yard reception, but if CeeDee Lamb had caught the ball instead, it likely would have gone for more than 13 yards.
Based on my model, Lamb had a 60% chance of being targeted, given the play and the surrounding conditions. Still, when a receiver is that wide-open, it’s tough to pass up the guaranteed yardage.
WR Rashod Bateman, Baltimore Ravens: 7.8 Predicted Targets, 7 Actual Targets 7
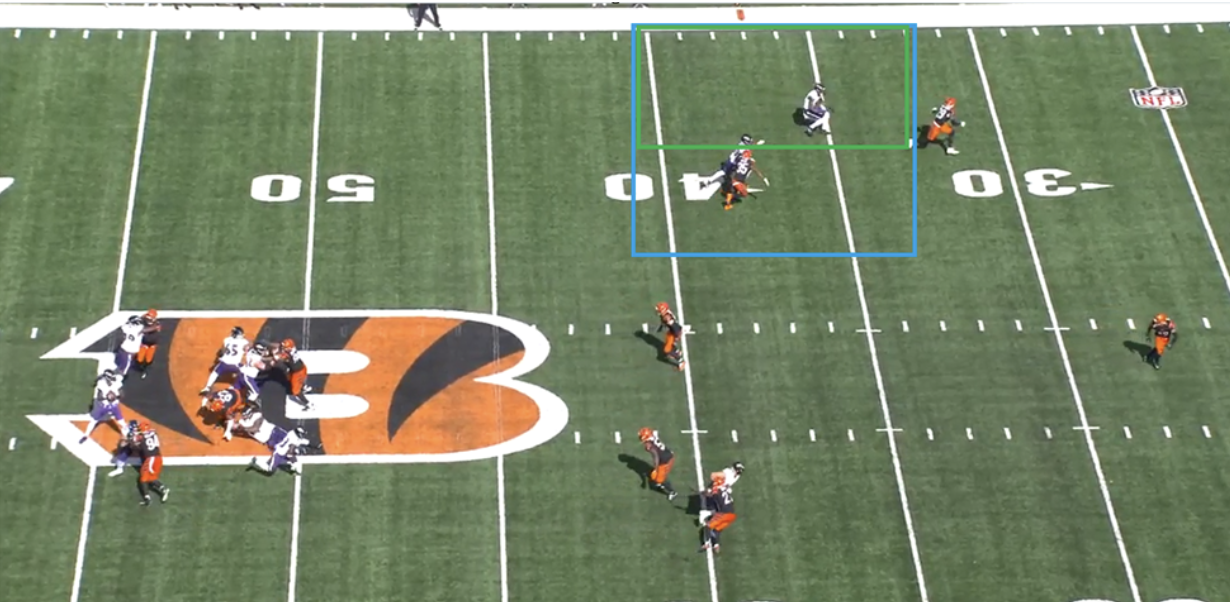
Lamar Jackson ended up throwing this to Justice Hill, and there was offensive holding on the play. I'm not sure if Jackson knew about the penalty, but Bateman was wide open on a hitch/comeback route at the top of the play. There was a 40%-plus chance of Bateman being targeted.
WR George Pickens, Pittsburgh Steelers: 4.0 Predicted Targets, 6 Actual Targets 6
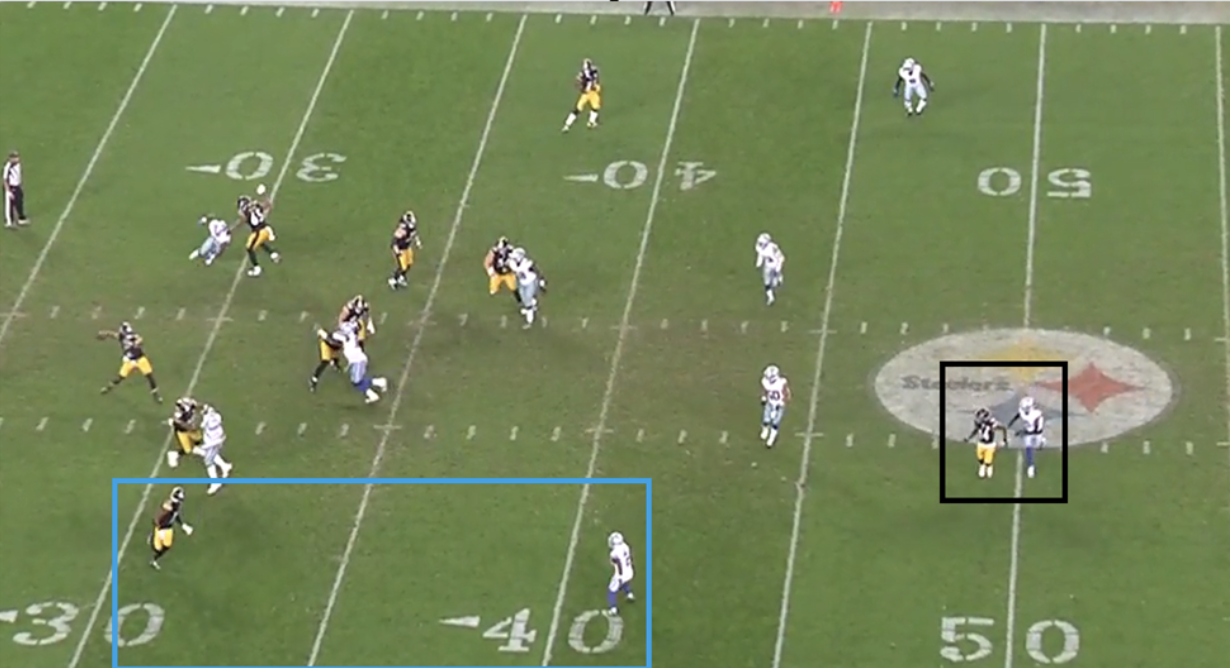
Pickens was targeted in some strange ways on Sunday Night Football. He ran 15 qualifying routes for the model — three of his six Actual Targeted routes had less than a 25% chance of being targeted.
On the play above, Trevon Diggs was step-for-step with Pickens, and it was a pretty tough throw. It was second-and-5, and Van Jefferson was wide-open underneath for an easy first down. According to my model, Jefferson had a 39% chance of being targeted, while Pickens had a 6% chance.
Thank you for reading my weekly article. I hope you enjoyed it. You can follow me on X/Twitter for more interesting statistical models and predictions.


 © 2025 PFF - all rights reserved.