When the Tennessee Titans‘ play-action game seemed unstoppable for the Kansas City Chiefs‘ defense on Sunday afternoon and the Titans took 10-0 and 17-7 leads, a team-agnostic win probability model (a model that knows only the score and time remaining of the game) had the Titans’ chances to win the game at above 80%. Our own win probability model at PFF, which accounts for the strengths of the teams, had the Titans going to the Super Bowl 60% of the time after offensive lineman Dennis Kelly caught a touchdown to put them up by 10 for the second time. The live betting market, however, never considered the Titans to be the favorite during the game, illustrating the sheer confidence the Chiefs inspire in the public. It’s not hard to figure out where the confidence comes from.
Patrick Mahomes might be on the verge of playing the best postseason we’ve ever seen, and one could fill a whole article with the superlatives, starting with averaging 0.58 expected points added per pass play while already having nine of his passes dropped in only two games (12% of his passes were dropped). In the AFC title game, he didn't register one negatively graded throw, and his overall PFF grade through the first two postseason games is a whopping 95.7 — easily the highest among the twelve playoff quarterbacks. In this article, we want to compare his play in different facets to other postseasons since 2006 (when we started thoroughly collecting data) and address the difficulties one encounters when doing such a small-sample analysis.
Mahomes and his offense are playing at an unprecedented level
We start with a simple scatterplot that shows the raw PFF grade on dropbacks and the expected points added (EPA) per pass play for all quarterbacks who played at least two games in a given postseason.
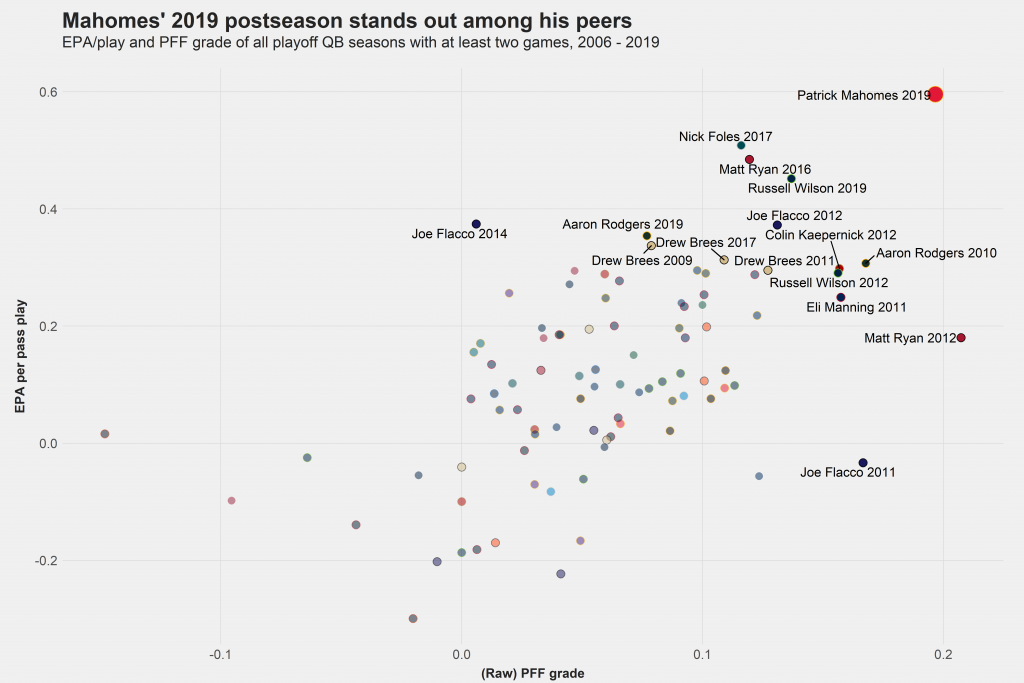
The labeled seasons are either top 10 in terms of PFF grade or EPA/play or both. Mahomes has so far clearly separated from the pack, registering the best postseason in terms of EPA per play (despite suffering from multiple drops on 3rd down), and his grade trails only Matt Ryan’s vastly underrated 2012 playoff run. Ryan’s run seven years ago doesn’t look too impressive in the box score, but his solid 6:3 touchdown-to-interception ratio looks much better if we know that he had only one turnover-worthy play but 11 big-time throws. Safe to say, it wasn’t his fault the Falcons blew a second-half lead to the San Francisco 49ers in the NFC title game.
The random nature of a small-sample contest like the NFL playoffs also comes to fruition, as we are reminded of Eli Manning’s and Nick Foles’ impressive Super Bowl runs and Joe Flacco’s postseason excellence. Flacco appears three times on this list, a feat he shares with only Drew Brees. On the flip side, neither Peyton Manning nor Tom Brady (who combined to win five of 13 Lombardi Trophies since 2006) made it on the shortlist of excellent postseasons since 2012, and the campaigns that came closest (2017 for Brady; 2009 and 2013 for Manning) were the ones they didn’t end up winning.
The small sample sizes imply that, while of course crucial to winning a Lombardi Trophy, postseason play shouldn’t necessarily have the largest role when assessing the career of a quarterback. Nevertheless, it’s at the very least an interesting descriptive analysis to perform. And we want to look a bit further, investigating Mahomes’ performance against his peers in different facets of quarterback play.
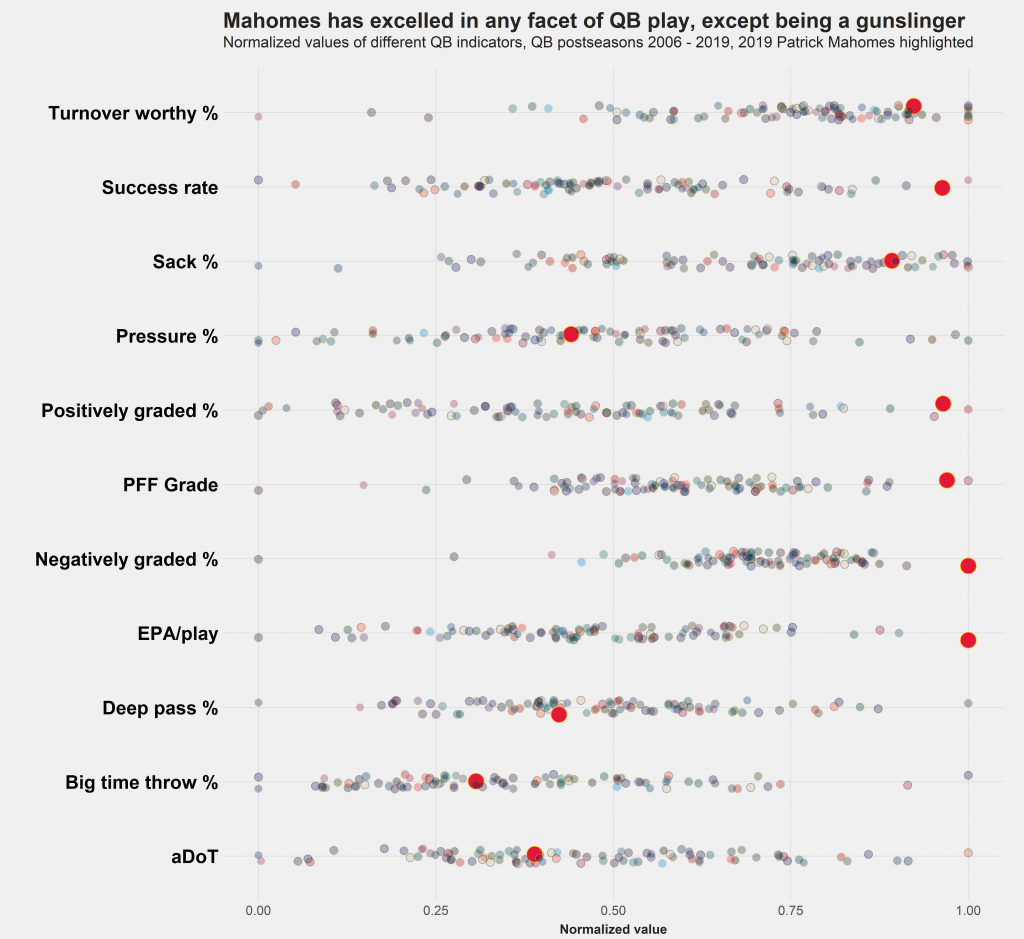
Note that for negative measurements (negatively graded throws, sack and pressure rate and turnover-worthy plays) the scale is chosen such that ‘1' indicates the best performance, i.e. avoiding negatives. Mahomes is at or near the top in any measurement of quarterback play other than the rate of big-time throws, which is an interesting contrast to him ranking second in big-time throws since the start of 2018 — behind only Russell Wilson. His play has been most impressive because he hasn’t made any mistakes (he ranks first in avoiding negatively graded plays by a fairly wide margin) and still has an extremely high rate of positive plays. However, he hasn’t shown much of a gunslinger mentality, as his aDoT and percentage of deep passes are relatively low. Given that the Chiefs trailed by 24 and 10 points, respectively, in his games, this speaks for a calmness and confidence in his and his teammates’ abilities, even when going through temporary adversity. Instead of going for the big play through the air, he has picked his spots and taken what the defense gives him. This also includes successful scrambling: Mahomes has added 8.4 expected points through scrambling — only six quarterbacks have added more through one postseason since 2006.
Mahomes has invited a lot of pressure but hasn’t taken many sacks against the Texans and Titans, mostly because he can make all kinds of throws from all platforms and thus can wait until the last moment before he releases the ball toward an open receiver. If the 49ers want to hinder Mahomes from etching his name in history for playing one of the best postseasons ever, bucking this trend with their talented defensive line would surely come in handy.
Bayesian updating can help with different sample sizes
Our analysis comes with at least two blind spots, the first of them being different sample sizes. Eli Manning had to go through the Wildcard Game in 2011 and dropped back 181 times during the postseason, while Russell Wilson had only 80 dropbacks in 2012, mainly because he lost his second game to the aforementioned Matt Ryan. While it obviously wasn’t Wilson’s fault in the loss to Atlanta, we can still only evaluate what happened. Thus, Eli’s performance in 2011 should get a higher weight than Wilson’s performance in 2012. The question is by how much do we have to bump up Eli, and is it enough to close the gap to Wilson?
A good way to come up with a non-arbitrary sample size adjustment is the application of Bayesian Inference. One can read about the methodology (particularly in football analytics) in a stellar article from our own Kevin Cole. We start with a prior distribution for each quarterback. To get on a level playing field (we only want to evaluate postseason performance, not what a quarterback has done in the regular season or in other years), we choose this to be the average postseason performance of all quarterbacks in the last 13 years. With each throw, this prior is updated to a posterior mean, a figure that lies between the prior and the sample mean. The exact position depends largely on the sample size, and quarterbacks who dropped back more often will move closer to their sample mean, giving their performance a higher weight.
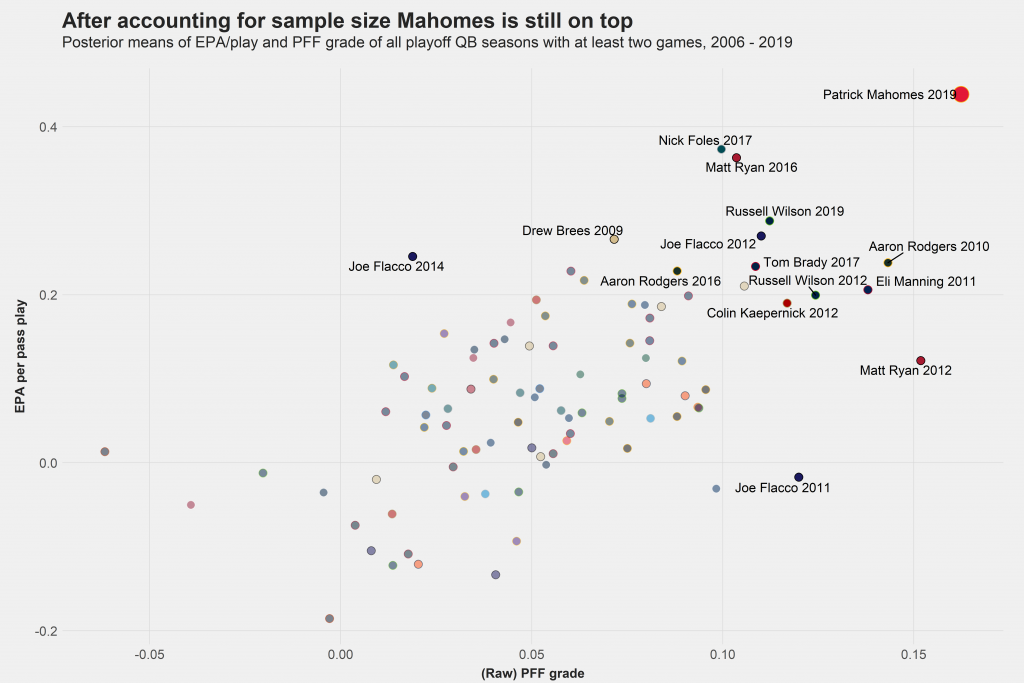
After completing this process, Mahomes’ performance so far in the 2019 postseason still stands out, and he even took the top spot on the PFF grade axis since he had more dropbacks than Ryan in 2012. As a rule of thumb, all postseasons that ended with a Super Bowl berth look better now — in particular, Brady’s 2017 campaign made it on the top 10 list. Another new name is Aaron Rodgers, who didn’t make the Super Bowl but played three games because he had to go through the Wildcard Round before shattering the Cowboys’ dreams in the Divisional Round. We also find that Eli’s stellar performance on a larger sample in 2011 has been indeed enough to be ranked higher than Wilson's performance on a smaller sample one year later.
To stay at the top after the conclusion of the Super Bowl against the San Francisco 49ers, it would obviously be enough to be graded as well as Ryan’s posterior mean in 2012 and reach Ryan’s and Foles’ posterior EPA per dropback from 2016 and 2017. To get a feeling for this, Mahomes would have to reach his average EPA per dropback from the 2018 season, and to gain that good of a grade, he should get positively graded on each third dropback and have very few negatively graded throws. Accomplishing both of these feats would rank in the 85th percentile among all postseason games since 2006, a fairly difficult task against one of the best defenses in the league.
Adjusting for defense
Speaking of defenses, there is another blind spot we should talk about. Mahomes hasn’t faced stellar defenses so far, as the Titans and Texans ranked 25th and 20th, respectively, in pass-rush grade and 20th and 24th in coverage this season. Ryan in 2012, however, faced the Legion of Boom, which ranked first in coverage grade, and the vaunted 49ers defense of the start of last decade, which ranked fourth in coverage led by linebackers Patrick Willis and Navorro Bowman.
While defense is relatively volatile compared to offense and thus adjusting for defense basically doesn’t add any predictive power, it’s still interesting from a descriptive standpoint. However, whenever adjusting for defense, one has to be careful not to overreact. For that matter, we train a mixed-effects model that regresses the metric in question (EPA or passing grade) against the offense on the play level and uses the defense as a random effect. We use the random fits to adjust postseason play for defense. A linear regression on a game level suggests we have to further multiply the fitted random effect by a factor of 0.8 to obtain the best guess of how a defense influences offensive performance in a given game.
To illustrate how our method differs from a naive defense adjustment, here is a chart that shows the adjustments we perform for 2019 defenses and the observed performance of these defenses.
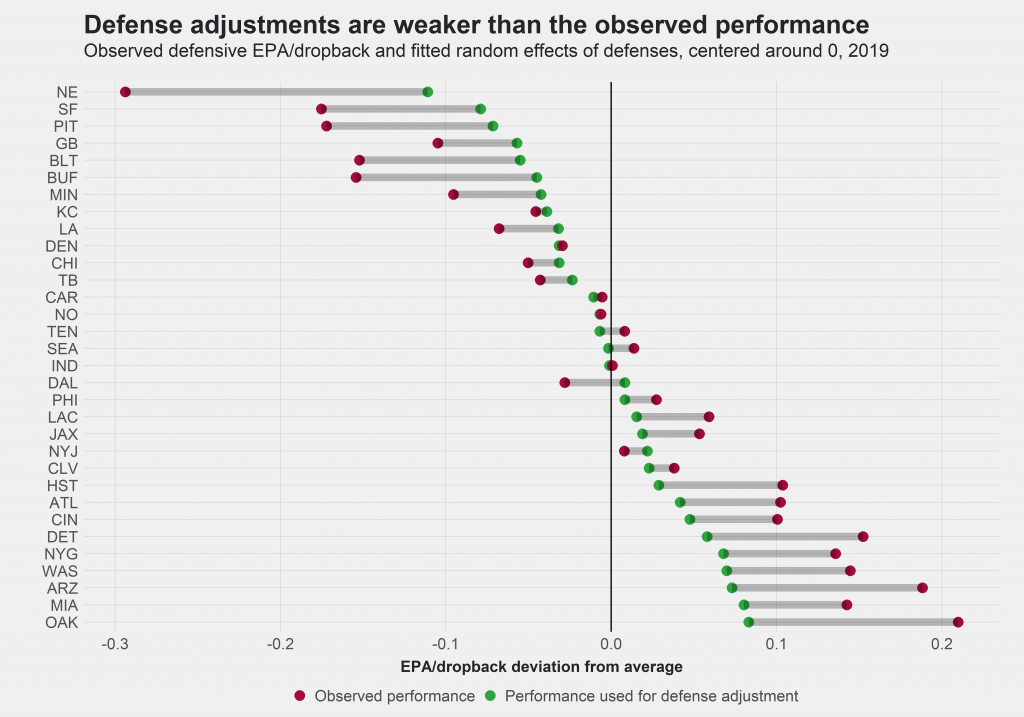
We bring it all together by applying the defense adjustments to each postseason and obtain a chart that accounts for sample size and for defense.
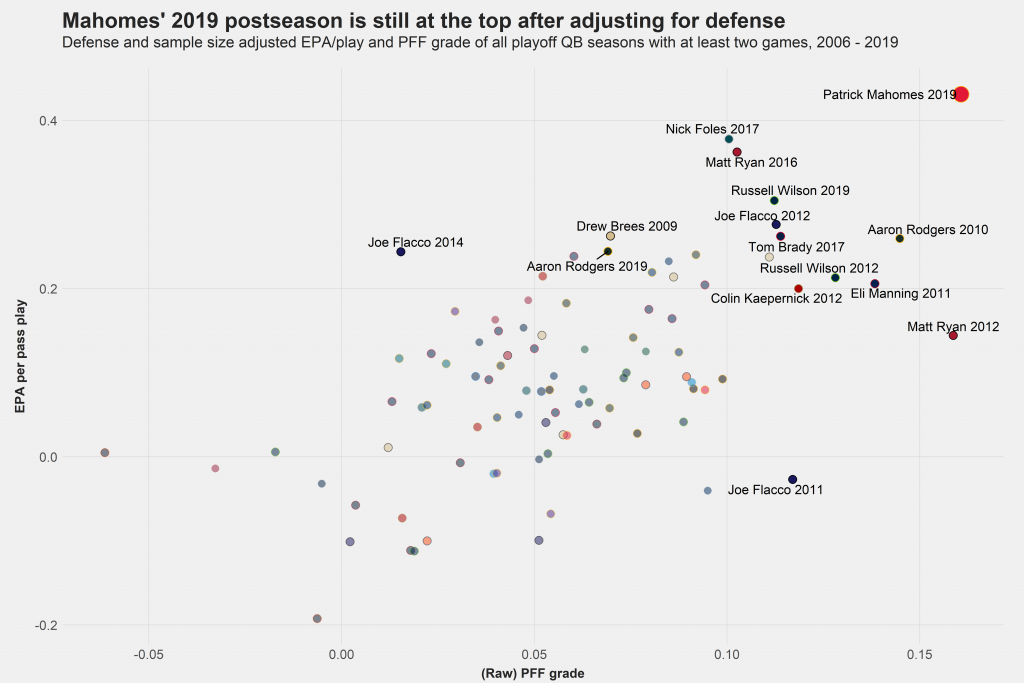
Even though Ryan closed the gap on the x-axis through getting credit for playing well against good defenses, Mahomes is still at the top in both metrics and thus, as far as our analysis goes, has played the most impressive postseason we’ve seen since 2006. If he manages to keep that top spot until after the Super Bowl, Andy Reid and him will be most likely decorated with their first ring, an ending to an unbelievable two-year run that would be well deserved.


 © 2025 PFF - all rights reserved.