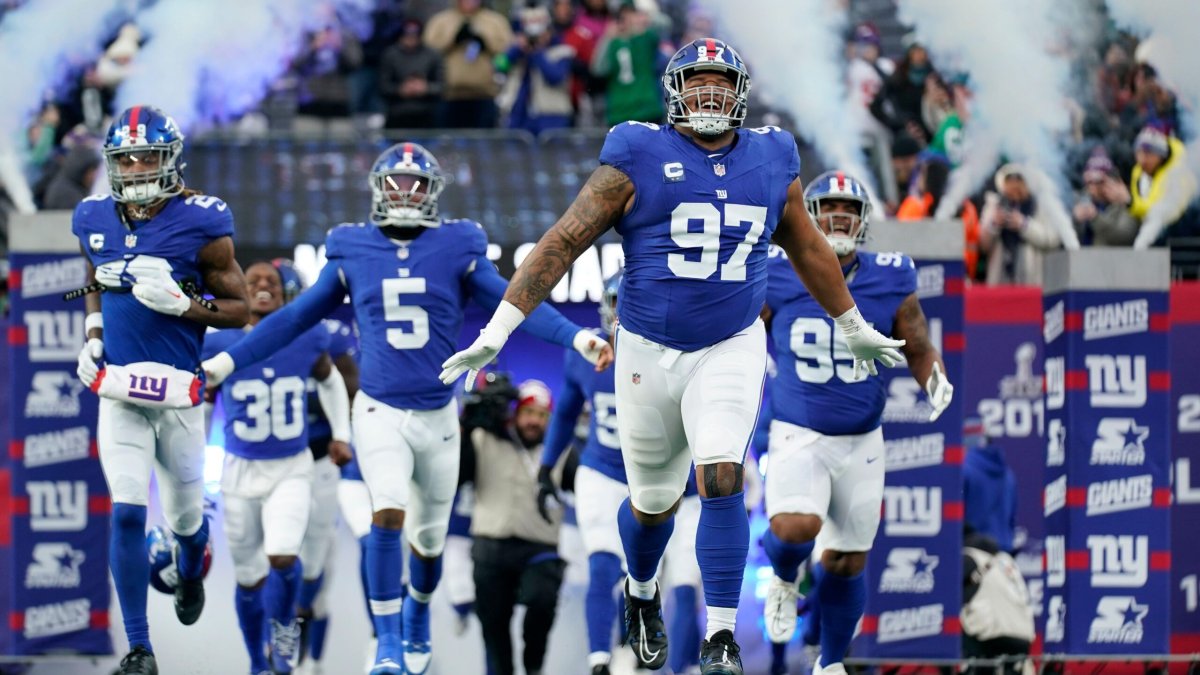
• The New York Giants defense has been doing its job: The Giants have disrupted 24.37% of passing plays this season, the highest rate in the NFL.
• Unlock your edge with a PFF+ subscription: Get full access to all our in-season fantasy tools, including weekly rankings, WR/CB matchup charts, weekly projections, the Start-Sit Optimizer and more. Sign up now!
Estimated reading time: 3 minutes
It’s never too early to start preparing for next season, and for PFF, that means looking at ways to improve PFF Premium Stats. One way we’re looking to enhance the experience is by introducing more data into the mix.
Over the last several weeks, we've introduced a wide variety of potential new metrics, ranging from separation percentage and lockdown percentage to pass-blocking win rate and fourth-down aggressiveness.
Up next is “Disruption Rate,” which provides insights into a team's ability to effectively disrupt opposing passing offenses.
What is Pass-Rush Disruption Rate?
This metric evaluates the number of designed pass plays (excluding spikes) that do not result in a targeted pass. The formula:
(throwaways + hit as thrown + batted passes + QB scrambles + sacks)/
(Total drop backs – spikes)
Disruption Rate (2024)
| Team | Dropbacks faced | Disruptions | Disruption Rate |
| New York Giants | 238 | 58 | 24.37% |
| Houston Texans | 227 | 54 | 23.79% |
| Los Angeles Chargers | 190 | 43 | 22.63% |
| Las Vegas Raiders | 223 | 48 | 21.52% |
| Denver Broncos | 250 | 52 | 20.80% |
| New York Jets | 222 | 45 | 20.27% |
| Arizona Cardinals | 208 | 42 | 20.19% |
| Kansas City Chiefs | 207 | 41 | 19.81% |
| Seattle Seahawks | 223 | 44 | 19.73% |
| Pittsburgh Steelers | 227 | 44 | 19.38% |
| Cincinnati Bengals | 238 | 46 | 19.33% |
| Tampa Bay Buccaneers | 295 | 57 | 19.32% |
| Chicago Bears | 224 | 43 | 19.20% |
| Tennessee Titans | 172 | 33 | 19.19% |
| Philadelphia Eagles | 191 | 36 | 18.85% |
| Los Angeles Rams | 164 | 30 | 18.29% |
| Green Bay Packers | 247 | 45 | 18.22% |
| Baltimore Ravens | 271 | 49 | 18.08% |
| Minnesota Vikings | 268 | 48 | 17.91% |
| New Orleans Saints | 269 | 48 | 17.84% |
| Dallas Cowboys | 208 | 37 | 17.79% |
| Jacksonville Jaguars | 270 | 48 | 17.78% |
| Miami Dolphins | 150 | 26 | 17.33% |
| Indianapolis Colts | 230 | 39 | 16.96% |
| Cleveland Browns | 212 | 35 | 16.51% |
| Washington Commanders | 215 | 35 | 16.28% |
| Buffalo Bills | 241 | 38 | 15.77% |
| New England Patriots | 241 | 38 | 15.77% |
| Detroit Lions | 250 | 37 | 14.80% |
| San Francisco 49ers | 225 | 33 | 14.67% |
| Carolina Panthers | 208 | 30 | 14.42% |
| Atlanta Falcons | 230 | 33 | 14.35% |
Disruption Rate (2023)
| Team | Dropbacks | Disruptions | Disruption Rate |
| Buffalo Bills | 695 | 158 | 22.73% |
| Green Bay Packers | 653 | 146 | 22.36% |
| Kansas City Chiefs | 683 | 147 | 21.52% |
| New York Jets | 638 | 136 | 21.32% |
| Miami Dolphins | 696 | 148 | 21.26% |
| Las Vegas Raiders | 678 | 143 | 21.09% |
| Cleveland Browns | 658 | 138 | 20.97% |
| Dallas Cowboys | 644 | 132 | 20.50% |
| Cincinnati Bengals | 679 | 133 | 19.59% |
| Baltimore Ravens | 779 | 152 | 19.51% |
| Atlanta Falcons | 662 | 129 | 19.49% |
| New Orleans Saints | 671 | 129 | 19.23% |
| Pittsburgh Steelers | 690 | 130 | 18.84% |
| Tennessee Titans | 690 | 127 | 18.41% |
| Detroit Lions | 710 | 129 | 18.17% |
| Los Angeles Rams | 719 | 130 | 18.08% |
| Washington Commanders | 700 | 125 | 17.86% |
| Arizona Cardinals | 611 | 109 | 17.84% |
| Seattle Seahawks | 702 | 125 | 17.81% |
| Denver Broncos | 675 | 120 | 17.78% |
| Jacksonville Jaguars | 727 | 129 | 17.74% |
| Houston Texans | 696 | 121 | 17.39% |
| San Francisco 49ers | 751 | 128 | 17.04% |
| Tampa Bay Buccaneers | 719 | 121 | 16.83% |
| Indianapolis Colts | 668 | 112 | 16.77% |
| Los Angeles Chargers | 701 | 115 | 16.41% |
| New England Patriots | 673 | 110 | 16.34% |
| Carolina Panthers | 553 | 89 | 16.09% |
| Minnesota Vikings | 698 | 111 | 15.90% |
| New York Giants | 661 | 103 | 15.58% |
| Philadelphia Eagles | 780 | 119 | 15.26% |
| Chicago Bears | 707 | 102 | 14.43% |


 © 2024 PFF - all rights reserved.