• Unlock your edge with a PFF+ subscription: Get full access to all our in-season fantasy tools, including weekly rankings, WR/CB matchup charts, weekly projections, the Start-Sit Optimizer and more. Sign up now!
Estimated reading time: 6 minutes
It's time for the fourth installment of “Coach, I Was Open,” my statistics series, where I build and refine a model to predict targets for every route in every NFL game.
In my first article, we discussed creating the foundational “predicted targets” model. The second article focused on refining this model and introduced powerful derivatives: “share of predicted targets” and “share of predicted air yards” (these derivatives have shown to be significantly more stable and predictive than their counterparts). In the third article, we explored the model's practical implications and how the predicted target probability was developed.
In today’s article, I want to focus on improving the base “predicted targets” model because one thing has been nagging me.
Currently, the model does not really understand the timing of the offense or defense. For example, a 15-yard post takes longer to run than a five-yard slant. How does defensive pressure affect this?
To address this, Timo Riske and I devised a solution that should help account for this: We can use the data on targeted throws to create a “predicted time to throw” model, just as we created a “predicted air yards” model.
To clarify our process:
We focus exclusively on targeted throws in our data set.
We create an XGBoost model based on these targeted throws, using features similar to those in our “predicted targets” model. Key factors include:
- PFF grade on route
- Type of route run
- Depth of the route
- Separation information (how open the receiver was on the play)
We aim to incorporate a new variable into our “predicted targets” model. This enhancement will introduce the feature known as Predicted Time to Throw, which will inform the model about the typical duration required for a route to be targeted.
Below is the variable importance chart, which indicates the significance of various factors the model considers when generating predictions.
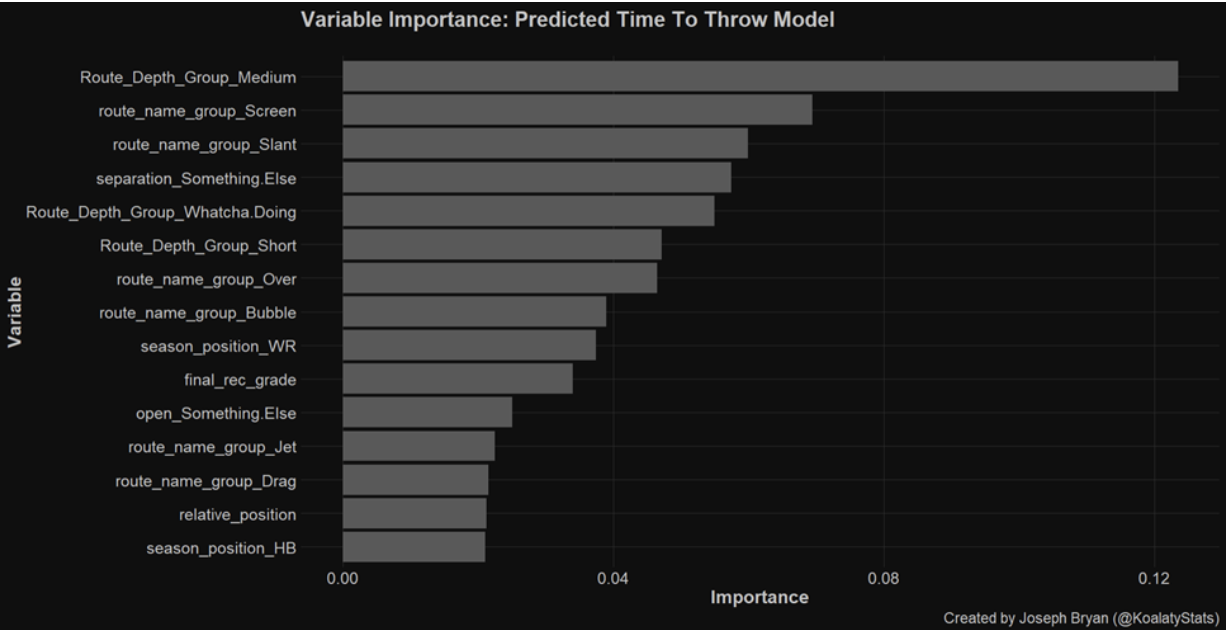
From top to bottom, the variable importance chart outlines the factors that contribute to the model:
The most important variable in the model is “Route Depth Group: Medium.” This means a player ran a route that cut between 10 and 25 yards down the field.
Next, we have “Route Name Group: Screen.” This just means the player was the intended target on a designed screen play.
Third, we have “Route Name Group: Slant.” It's just how it sounds: They ran a slant.
These variables are all very important in predicting the time to throw on a given play.
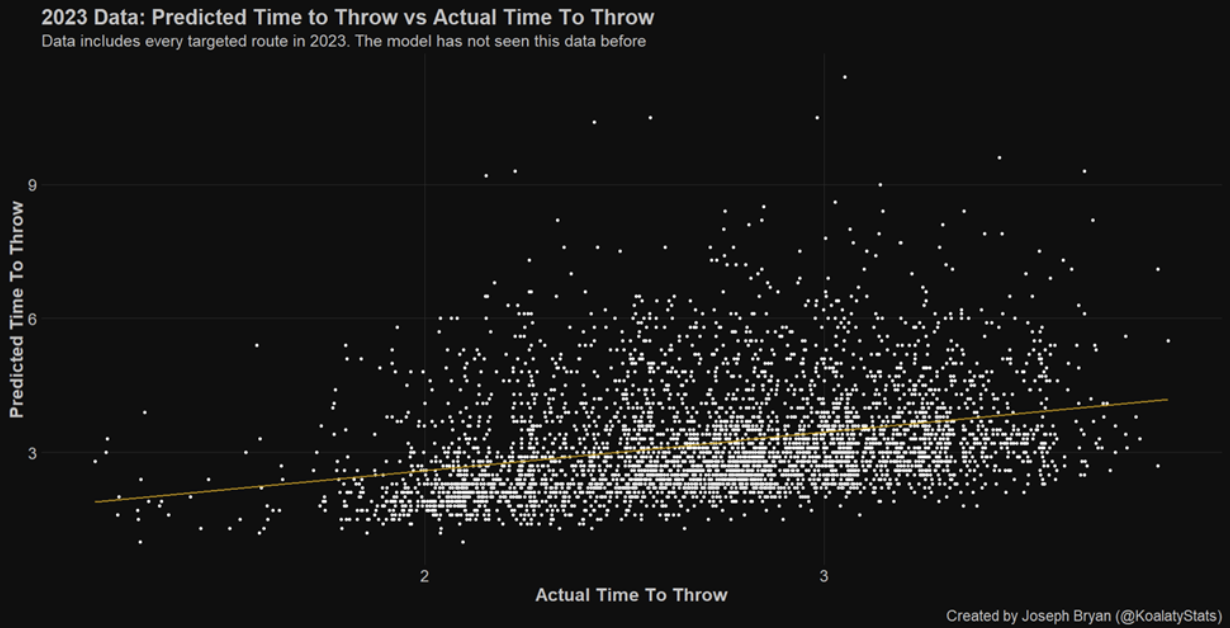
Our play-level validated R-squared is .31 on 2023 data. This is very good for a play-level variable. Next, we are going to add this as a feature to our “predicted targets” model.
I think this is important to note for people who aren’t familiar with data science:
• We created the time-to-throw model using targeted routes.
• We will use our new model to predict the time to throw for every route, whether it was targeted or not.
• This will become a variable in the “predicted targets” model, enabling it to determine how long it typically takes for a given route to be targeted.
In our first model, we achieved a validated R-squared of 0.53, which is good but has room for improvement (this indicates that 47% of the variance remains unexplained). Our goal is to identify and account for that unexplained variance within our variables and features.
Our old model did not include information about time to throw or time to pressure, so we are incorporating this information now. We have also made some additions to our data filtering by adjusting for screens, bubbles and throwaways.
After implementing our improvements, we can now predict actual targets in a game using our “predicted targets” model. We've successfully increased our game-level validated R-squared to 0.75, which is a significant enhancement.

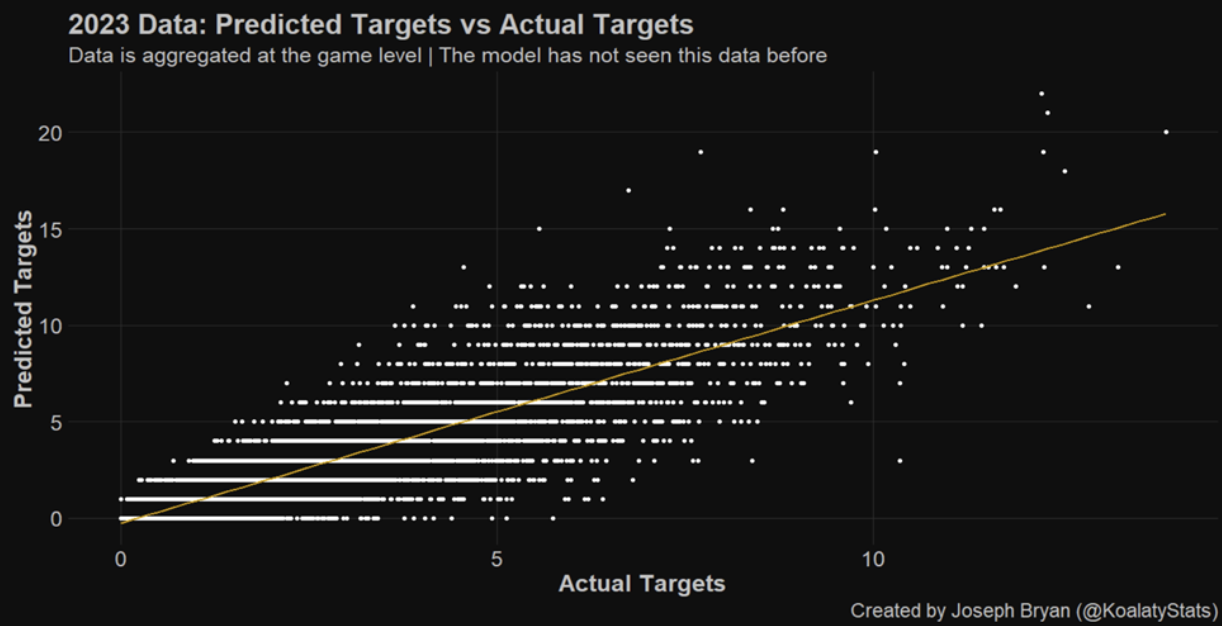
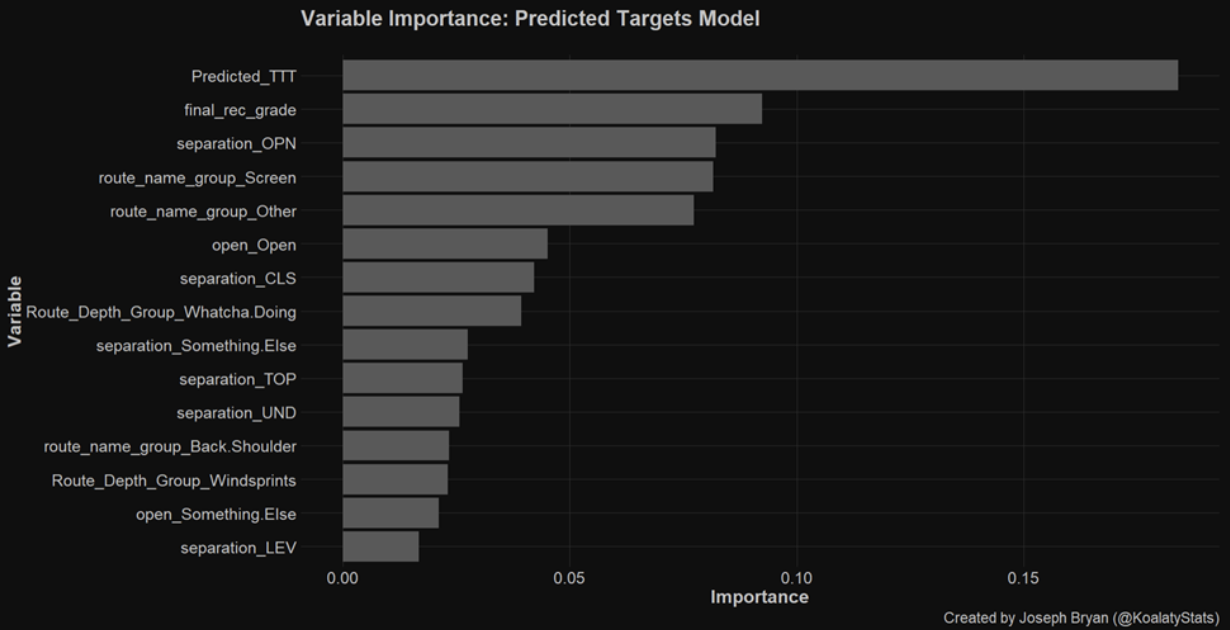
In our new model, “predicted time to throw” emerges as our most important variable, which is promising. This aligns well with our expectations, as predicted time to throw is a model in its own right and encompasses a wealth of information.
We also incorporated time to pressure, which does not appear in our top 15 variables. This does not imply that it lacks usefulness. Rather, it indicates that it is not as critical as other variables.
The final point I want to highlight is the quintessential “Coach, I Was Open” example from Week 7: Broncos receiver Courtland Sutton, who saw the largest difference between “predicted targets” and “actual targets” on the season so far.
Sutton had 6.5 predicted targets and one actual target, which counted as a “no play” because of a penalty.
In all, there were 13 plays on which Sutton had a target probability above 30%. This is the first time this season that a player has had so many targets with a probability above 30% and garnered one or fewer targets.
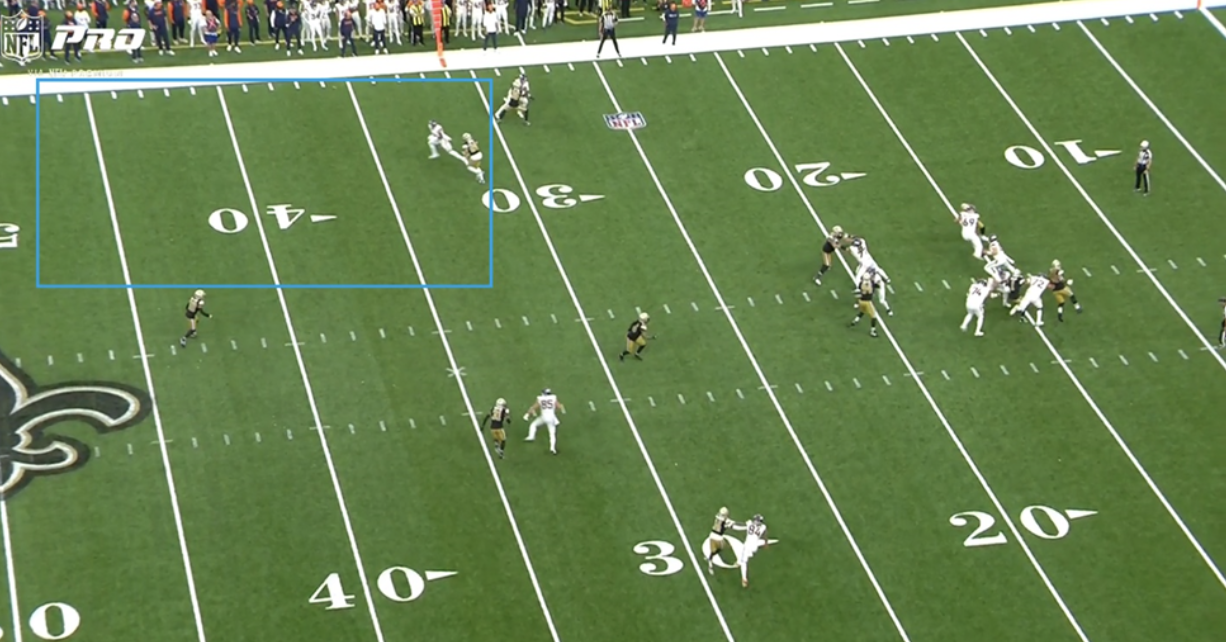
Above is Sutton’s highest-probability play, where he had a 62% chance of being targeted for what could have been a significant gain. Bo Nix had a relatively clean pocket and was looking in Sutton's direction but ultimately chose not to throw the ball. I expect Sutton to see a substantial increase in targets this week against a weak Panthers defense.
Now, let's explore the top leaders in “share of predicted targets” for the season. Remember, the formula for calculating this is:

Current Share of Predicted Targets Leaders
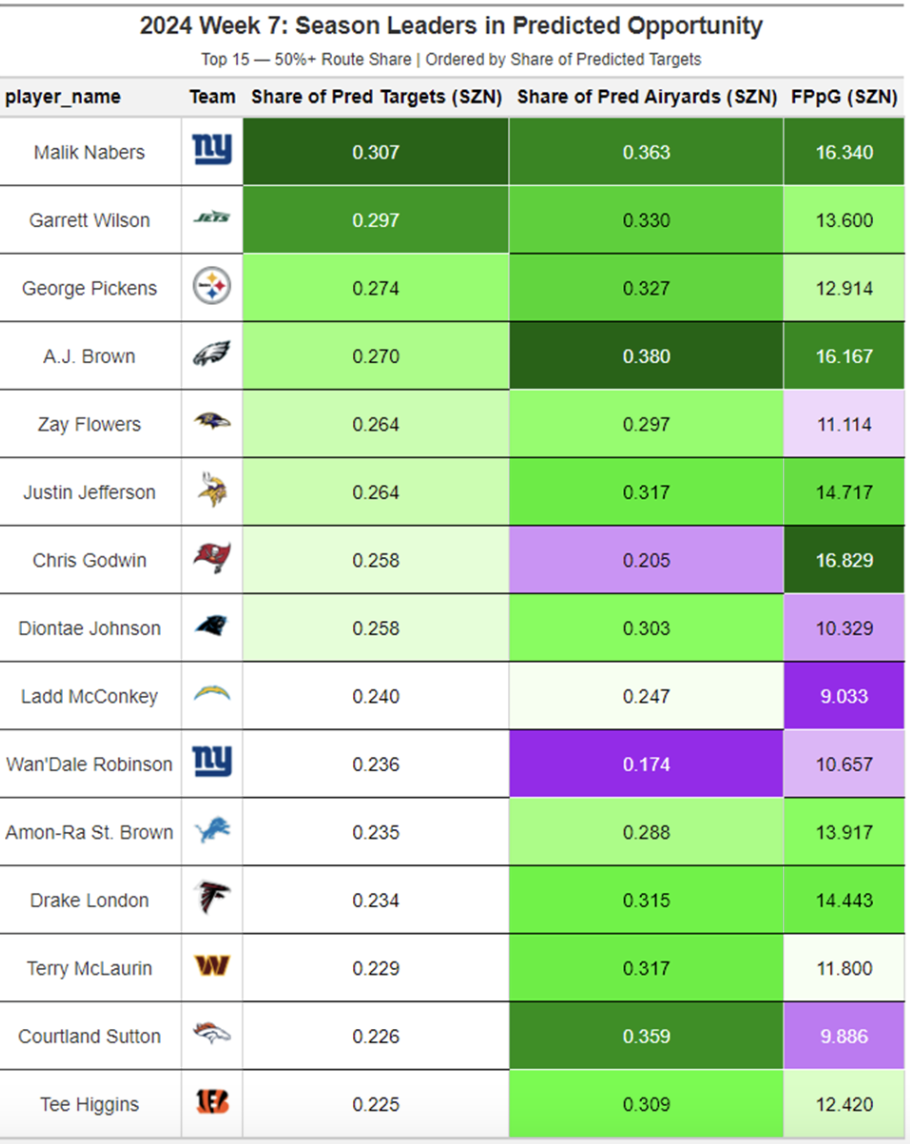
“Share of predicted targets” lets us know who is good at getting open relative to their team. “Share of predicted air yards” lets us know who is running valuable routes relative to their team.
George Pickens might just be elite, especially after his showing last week.
Ladd McConkey is doing great in both “share of predicted targets” and “share of predicted air yards.” It is a matter of time before he has an explosion game.
After last week’s one-target performance, we know Courtland Sutton will be asking head coach Sean Payton for some more looks.
Tee Higgins has a better share of predicted targets than Ja’Marr Chase.
Malik Nabers is truly elite, and this is probably the worst offense he will ever play in.
“Coach I Was Open” (from Week 7)
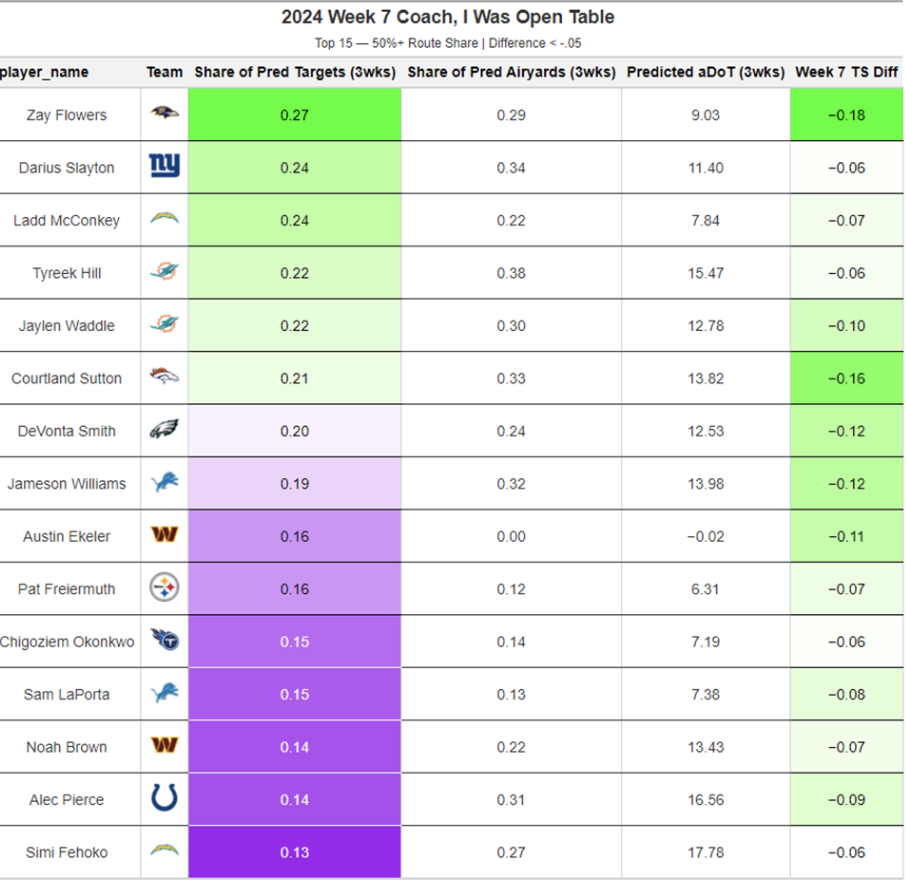
These players have a greater than 5% difference in “share of predicted targets” and “target share.” I included their three-week share of predicted targets, air yards, and predicted aDOT (Average Depth of Target).
These players all have a good case to ask for more targets this week. The higher their Predicted aDOT, the more valuable targets they will likely receive.
Ladd McConkey had a great game last week — in theory. With Justin Herbert throwing for 349 yards, it is shocking he did not break out.
Darius Slayton has been a darling in the “share of predicted targets” metric. With Nabers pulling targets away, this may not be the last time we see him on this table.
Tyreek Hill and Jaylen Waddle showing up is not a surprise. I fully expect Tua Tagovailoa to feed them when he returns in Week 8.
For more NFL stats and analysis, follow Joseph on Twitter/X.


 © 2024 PFF - all rights reserved.