Data analysis in football is unique. Early in the season, the sample sizes are too volatile to be considered representative. Late in the season, adjustments and attrition have a smoothing effect on uneven data – which is also known as regressing to the mean, every sports podcaster’s favorite phrase. Then, in the postseason, over 1,000 snaps of data are poured right back into single-game samples.
Click here for more PFF tools:
Rankings & Projections | WR/CB Matchup Chart | NFL & NCAA Betting Dashboards | NFL Player Props Tool | NFL & NCAA Power Rankings
Best Bets Tool
Defensively, it's easy to lean back on familiar coaching adages – and for good reason. It’s hard to go wrong with “stopping the run and affecting the quarterback,” as every defense aspires to accomplish both when a trip to the Super Bowl is on the line.
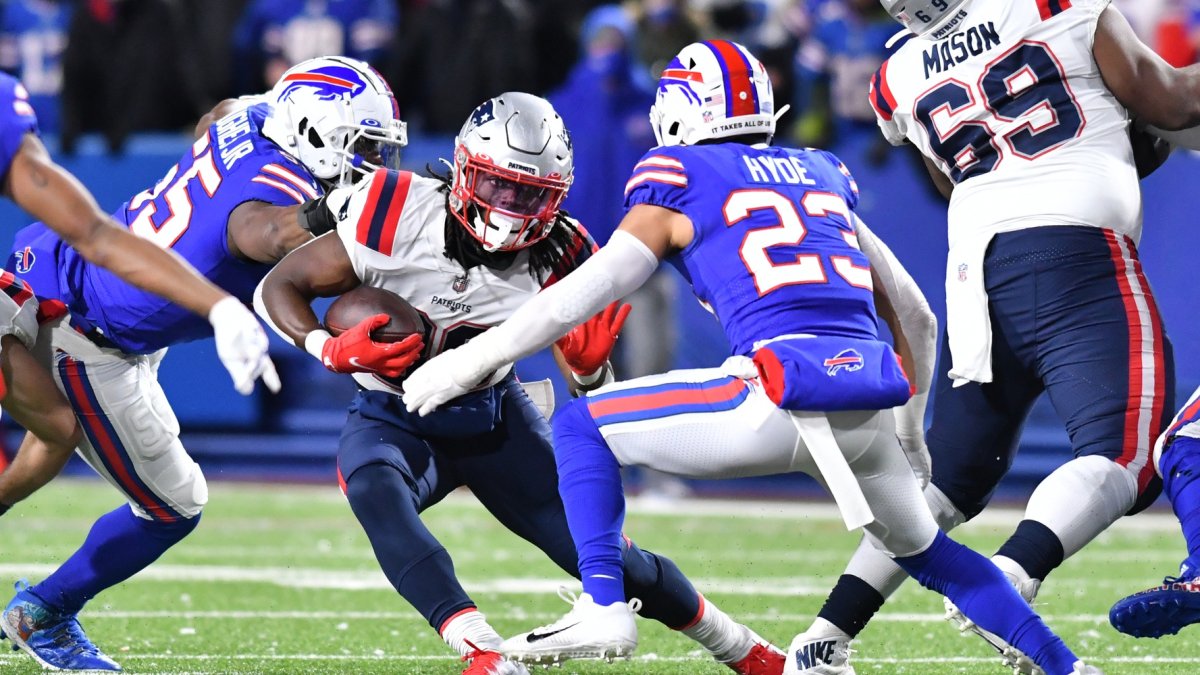
Today, we’re looking at the playoff defenses through the lens of “havoc.” At its heart, havoc represents the negative plays a defense creates. For the purpose of this conversation, havoc combines runs that are stopped for a loss or no gain in addition to passes that are broken up or intercepted.
Havoc is only as valuable as what it's being weighed against – explosive gains for an offense. Think of havoc and explosive gains in terms of margins and ratios — similar to a “plus-minus” statistic in basketball. These two metrics operate independently of each other, but both are reflective of the most important thing in football: big plays.
To add, we measured the havoc ratio against pressure rate and success rate on plays/drives. The conventional thinking is that pressure protects against poor matchups in coverage while defenses need negative plays to succeed possession-to-possession.
| AFC Teams | TFL/NG vs. Explosive Run | PBU/INT vs. Explosive Pass | Pressure Rate | Knockdown Rate |
| Tennessee Titans | 58:31 | 59:93 | 31% | 13% |
| Kansas City Chiefs | 75:45 | 56:102 | 33% | 13% |
| Buffalo Bills | 85:51 | 65:61 | 37% | 15% |
| Cincinnati Bengals | 67:47 | 54:103 | 33% | 13% |
| Las Vegas Raiders | 74:50 | 55:72 | 35% | 15% |
| New England Patriots | 59:50 | 76:70 | 34% | 13% |
| Pittsburgh Steelers | 71:72 | 51:88 | 32% | 16% |
| NFC Teams | TFL/NG vs. Explosive Run | PBU/INT vs. Explosive Pass | Pressure Rate | Knockdown Rate |
| Green Bay Packers | 44:54 | 69:76 | 37% | 12% |
| Tampa Bay Buccaneers | 78:52 | 65:92 | 36% | 15% |
| Dallas Cowboys | 60:52 | 77:96 | 36% | 14% |
| Los Angeles Rams | 75:45 | 68:94 | 34% | 12% |
| Arizona Cardinals | 88:63 | 43:72 | 30% | 16% |
| San Francisco 49ers | 80:44 | 46:83 | 34% | 16% |
| Philadelphia Eagles | 63:45 | 45:82 | 33% | 12% |
Exclusive content for premium subscribers

WANT TO KEEP READING?
Dominate Fantasy Football & Betting with AI-Powered Data & Tools Trusted By All 32 Teams
Already have a subscription? Log in


 © 2025 PFF - all rights reserved.