• Unlock your edge with a PFF+ subscription: Get full access to all our in-season fantasy tools, including weekly rankings, WR/CB matchup charts, weekly projections, the Start-Sit Optimizer and more. Sign up now!
Estimated reading time: 7 minutes

Hello, everyone, and welcome to the first installment of my PFF statistical model series.
My name is Joseph Bryan, and I enjoy creating advanced statistical models for NFL analysis. Today, I am excited to introduce my latest project: “Coach, I was open!” — a model designed to predict target distributions in NFL games.
An introduction
The idea for this model first came to me during the Eagles vs. Vikings matchup in Week 2 of the 2023 season. DeVonta Smith had a great game, finishing with four catches for 131 yards and a 75.4 PFF grade from five targets. His teammate, A.J. Brown, finished with four receptions for 29 yards and a 72.6 PFF grade across six targets — and he was visibly frustrated on the sidelines.
This raised a key question: why wasn’t Brown, an elite talent, getting more opportunities? Interestingly, just a week later, he was targeted 13 times.
There had to be a way to quantify these fluctuations in targets, and that’s what led me to develop this model.
Building the model
Up to five players may run a route on any given play, but only one will receive the target. By examining key data points and characteristics of that play, we can predict the probability of each player being targeted.
Alright, so you're looking to build a model. The first step is identifying the response variable, which is essentially the thing we care about. In this case, it's straightforward: the response variable is “Target” — whether or not a player received a target on a given play. Simple as that.
Next, we need to come up with some predictors. In our situation, we care about the following questions:
- What kind of route did the receiver run?
- How deep was the route?
- What was the down and distance?
- How well did the receiver run the route?
- What level of separation did they get?
- Were they open?
Each of these factors directly impacts the likelihood of a player being targeted. This will help our model determine what influences the decision to throw to a specific player on a given play.
Next, we need to put all these data into a mathematical model. I chose to use an XGBOOST model since we have a lot of data to process and complex, non-linear relationships everywhere.
XGBOOST models are machine learning models that examine the relationships between our response variable (targets) and our predictors (the list above) and learn how our predictors lead to our response variable.
Does an open 10-yard slant on first down have a higher probability of a target than a 15-yard open post route on third down? These are the relationships we are trying to teach our model with our predictors.
The computer then does a lot of computational work using our hyperparameters. I will not get in the weeds, but the key point is that we want a strong R-squared value, meaning our model can accurately predict outcomes on new data.
For example, if we train the model using data from 2019 to 2022, we want it to make good predictions for 2023. Many models you see online don’t do this properly, so be wary of those.
To access the data and grades during games,
sign up for a PFF+ subscription today
Model Results
Now, let's dive into the results.
Firstly, what factors predict targets on a play-by-play basis? While this isn't where the real value of the model lies, it's important to present this initial insight.
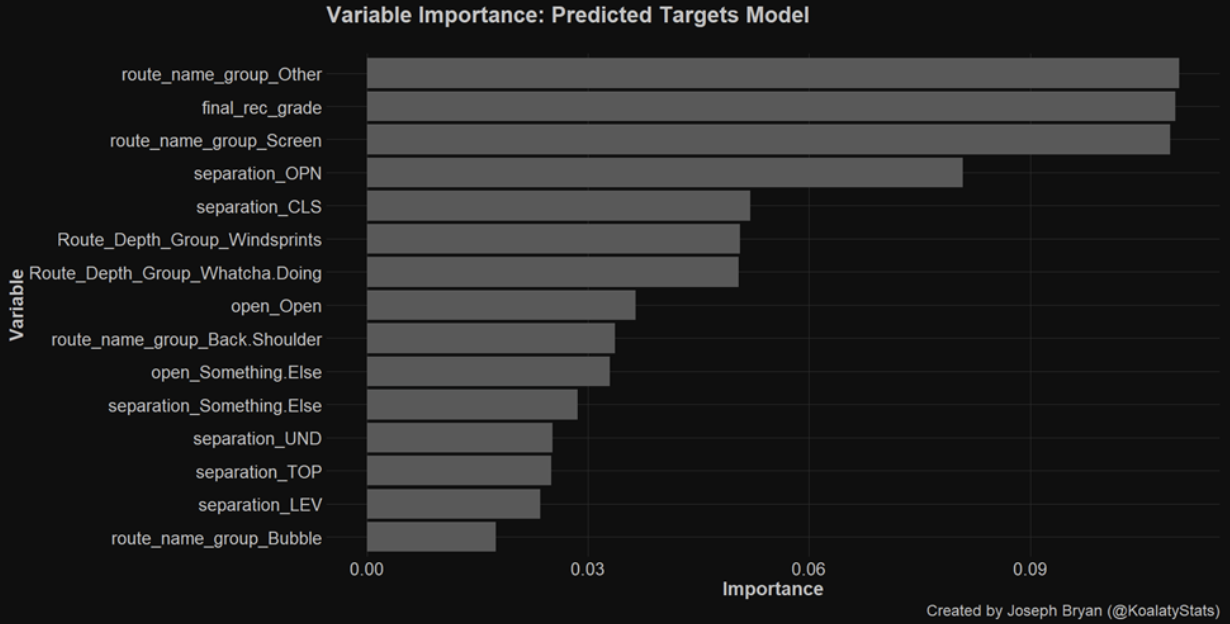
The variable names are probably mostly nonsense to you, but we can elaborate on our top three predictors:
1. “final_rec_grade” refers to the PFF grade assigned to the route runner, which serves as a positive indicator for both our model and PFF's evaluation system.
2. “route_name_group_Screen” indicates that the player ran a screen route. This is logical, as screens are typically designed for a specific player, making them more likely to receive the target.
3. “route_name_group_Other” is a bit more unusual, as it’s a classification I created. Essentially, it became a category for “wind sprints” or clearout routes that players run. This is predictive because it highlights situations where players are less likely to receive targets.
Now, let’s dive into the “predicted target” results on a game-by-game basis using 2023 data. Remember, this data is new to the model, meaning it hasn’t been trained on this information, making the predictions a true test of its accuracy.
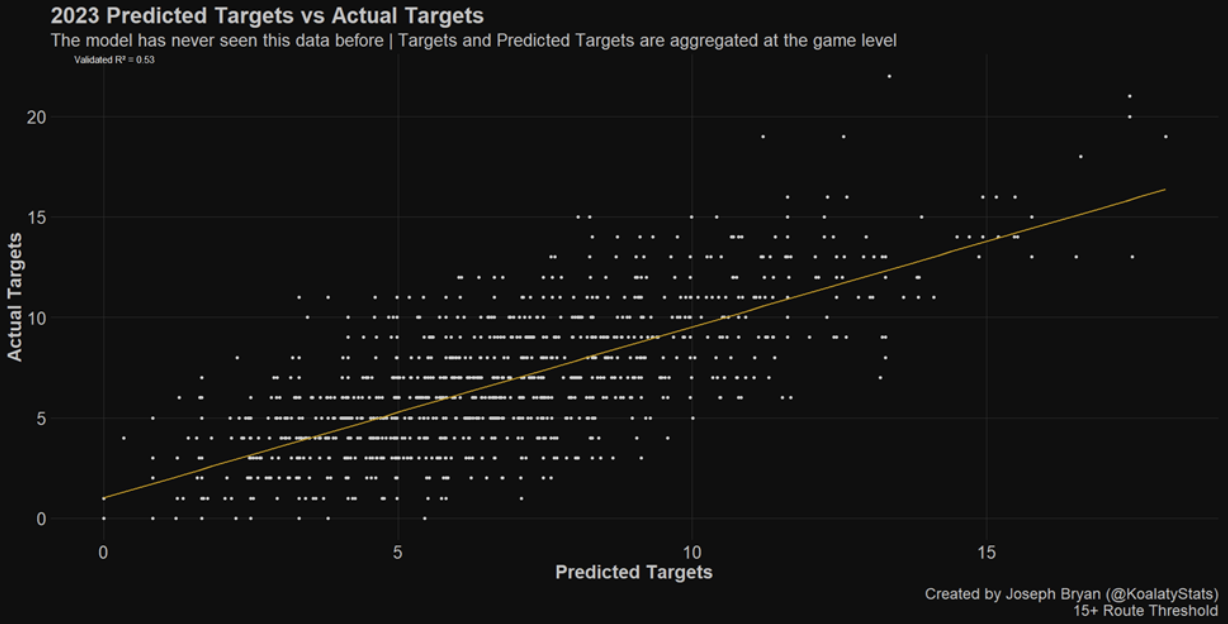
This means our new metric, “predicted targets,” can explain 53% of the variance in actual targets.
So, what does this mean for you and me? Let’s go back to the beginning of the article and revisit the earlier idea: “Interestingly, just a week later, Brown was targeted 13 times.”
What if, instead of comparing “predicted targets” to “actual targets,” we focus on the difference between the two and examine how many more targets a player receives in the following week compared to the current week?
Let's introduce a new metric called “CIWO” (Coach, I Was Open). CIWO represents the difference between the number of targets a player gets next week versus this week.
For example, if a player receives five targets one week and eight the next, their CIWO would be +3.
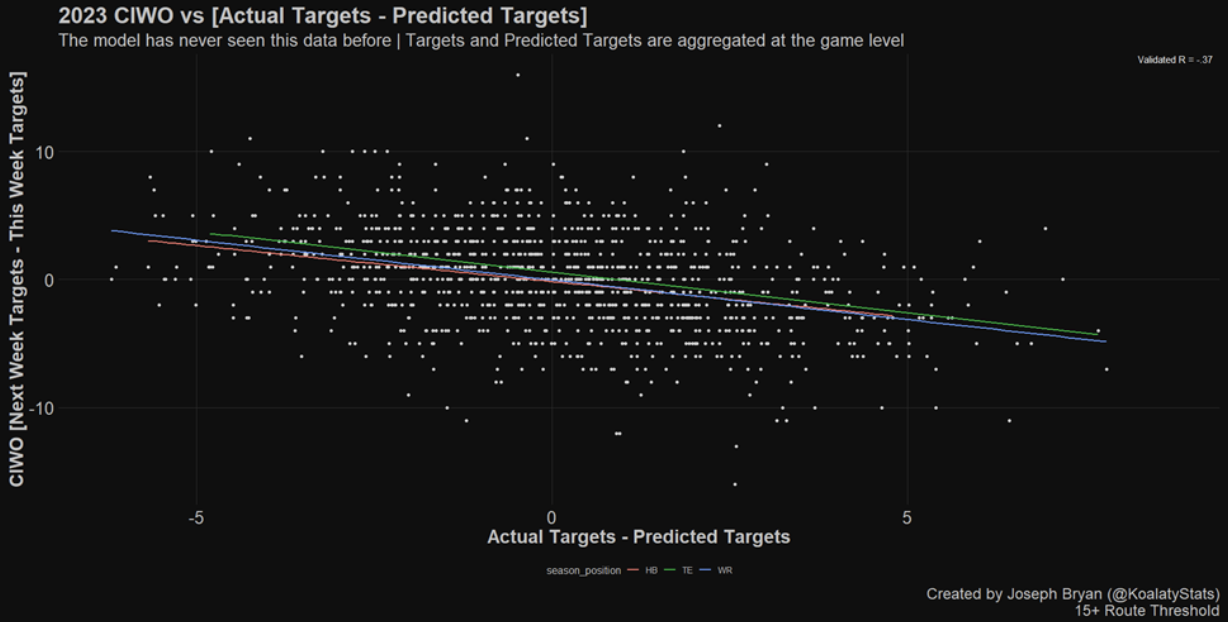
This graph may look complicated, but it's actually straightforward.
What it shows is simple: when a player has more “predicted targets” than actual targets, they are likely to see an increase in targets the following week compared to this week.
THIS WAS OUR INITIAL HYPOTHESIS AND IS SO COOL. This relationship held up for every position.
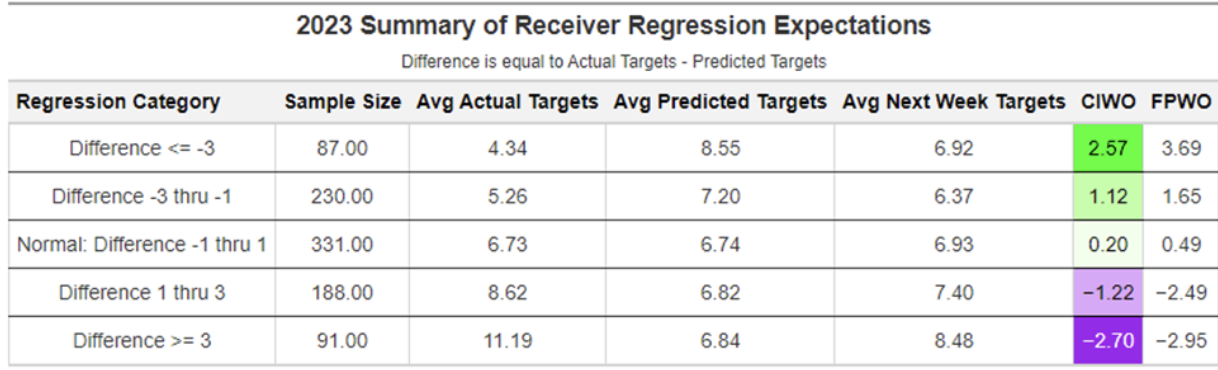
This table shows that when a player's “predicted targets” exceed their actual targets by three, they are expected to receive, on average, 2.57 more targets the following week.
FPWO is the same concept that is applied to Fantasy Points. A player with a -3 difference can expect a 3.69-point increase in fantasy points compared to the current week.
Astute observers may have noticed that “Difference >= 3” has the highest average next-week targets. My theory on this is simple: Teams force the ball to their best players. When players meet this threshold, we still see three fewer targets on average the following week.
Week 4 Predicted Targets Tables
The moment you have all been waiting for.
How can we practically use this model's results? Well, we can make some tables using our new metrics and some other variables that the nerds (me) care about.
Note: If the targeted player committed a penalty, the play is removed from the data. If another player commits the penalty, the play is not removed.
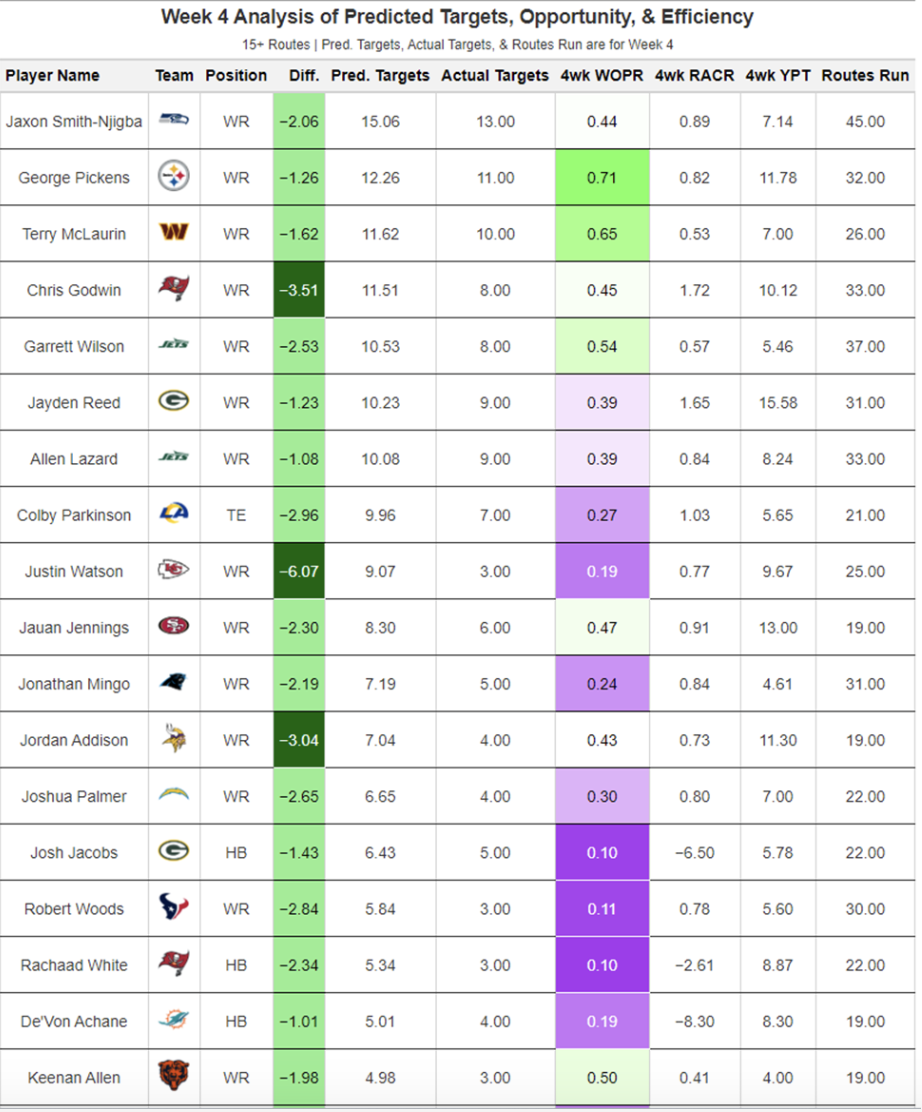
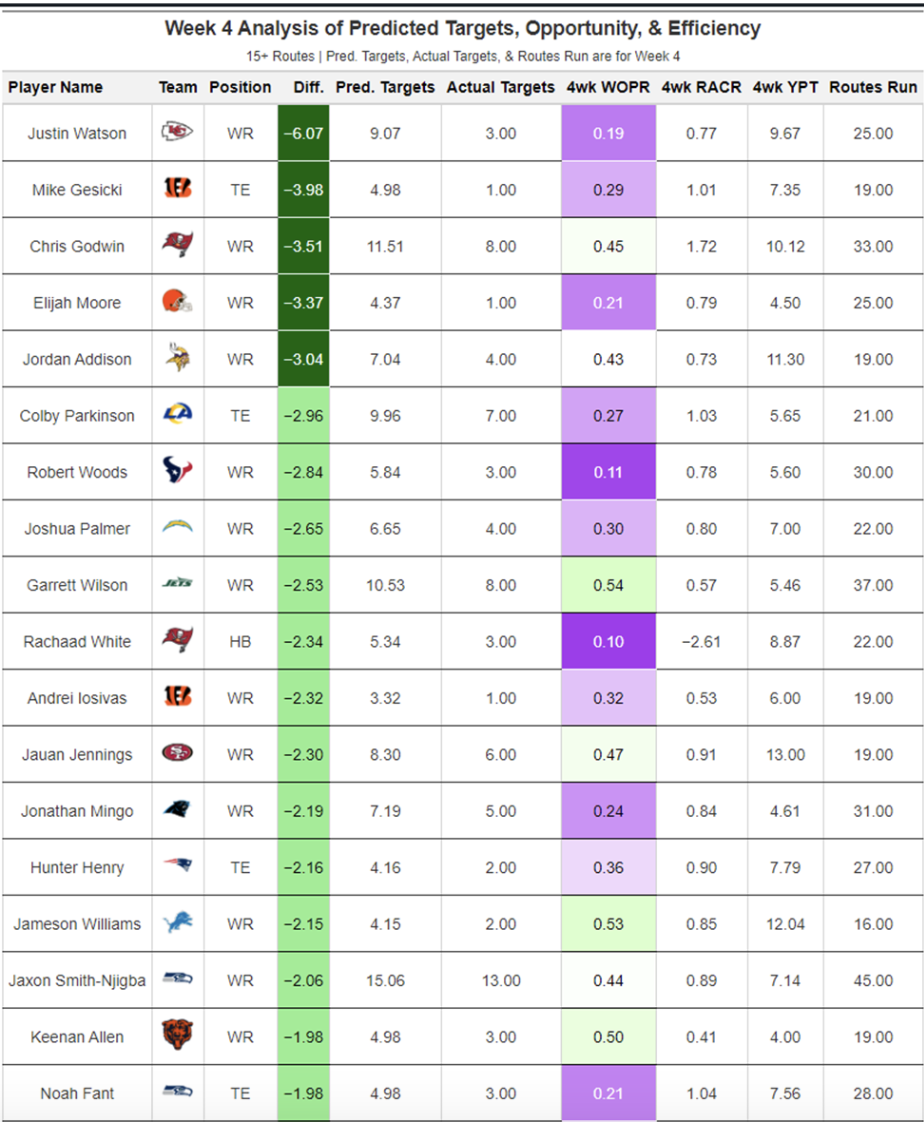
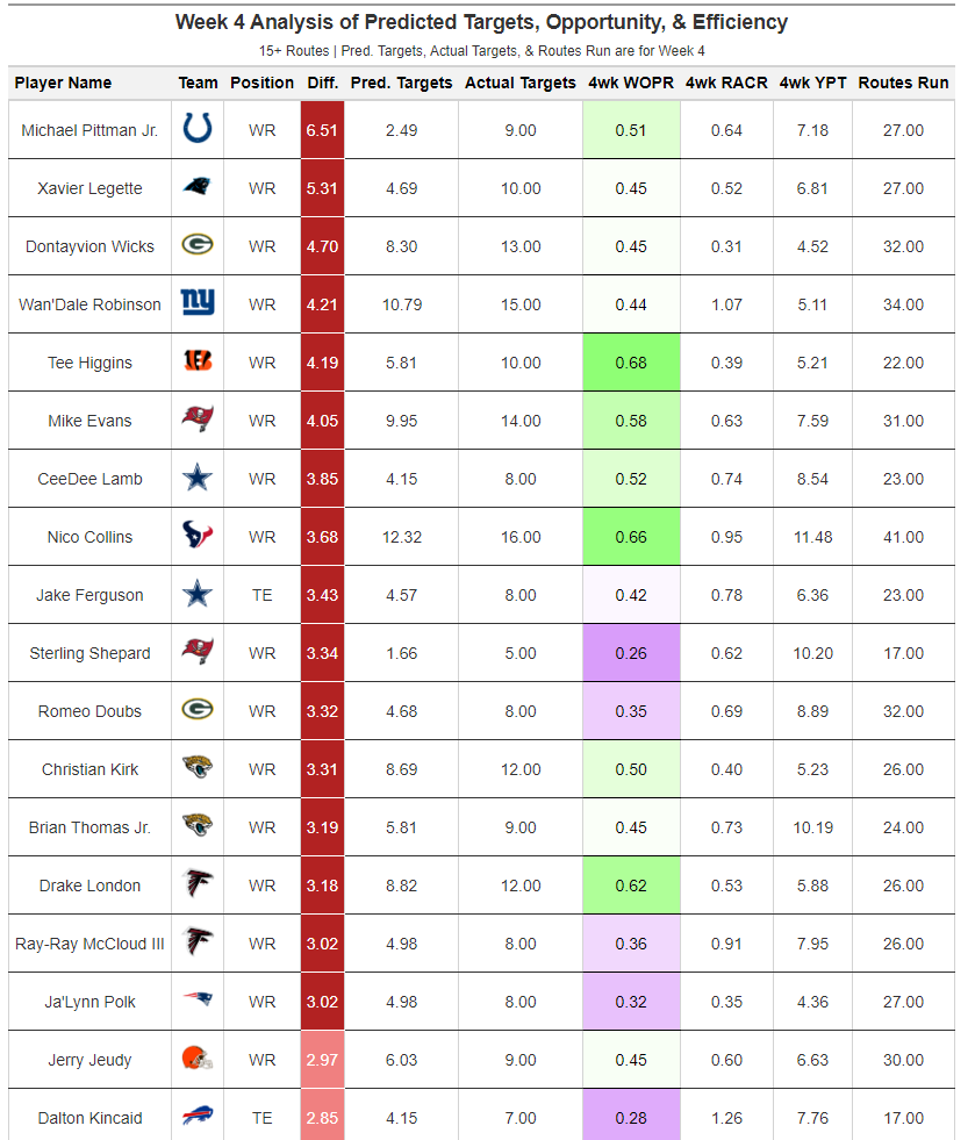
Note: I would be suspicious of players who are not elite and are on the red table. Elite players will get their targets whether they are open or not.
One way to think about “predicted targets” is that they are a representation of two things:
- How good or open a player was during the week
- How often a team schemed up looks for a given player
As we analyze these tables, it’s critical to know that the more targets a player saw in Week N, the harder it will be to have more targets in Week N+1.
The players who caught my eye were Chris Godwin, Justin Watson, Jordan Addison, Keenan Allen and Jameson Williams.
• Godwin is a massive target earner in a good offense, and Evans has a +4 Difference. If he negatively regresses in actual targets, those targets could be going Godwin’s way.
• Watson could see an increase in routes this week and had a really large difference.
• Addison should run more routes in a good passing offense.
• Allen should also run more routes this week.
• Williams is on bye this week but could look good next week.
Remember, when looking at the tables above, if the difference is less than -3, we can expect a 2.57 average increase in targets for those players. It is not definitive and certain for any individual player, but it is something we can expect in a broad sense. Any given player can fail, but as a unit, they see more targets.
Ultimately, this is just one piece of the large puzzle in predicting upcoming performances. We shouldn’t base all of our decisions on a single table or model. We should use many different sources to come to any good conclusion.
Follow Joseph on X at @KoalatyStats.