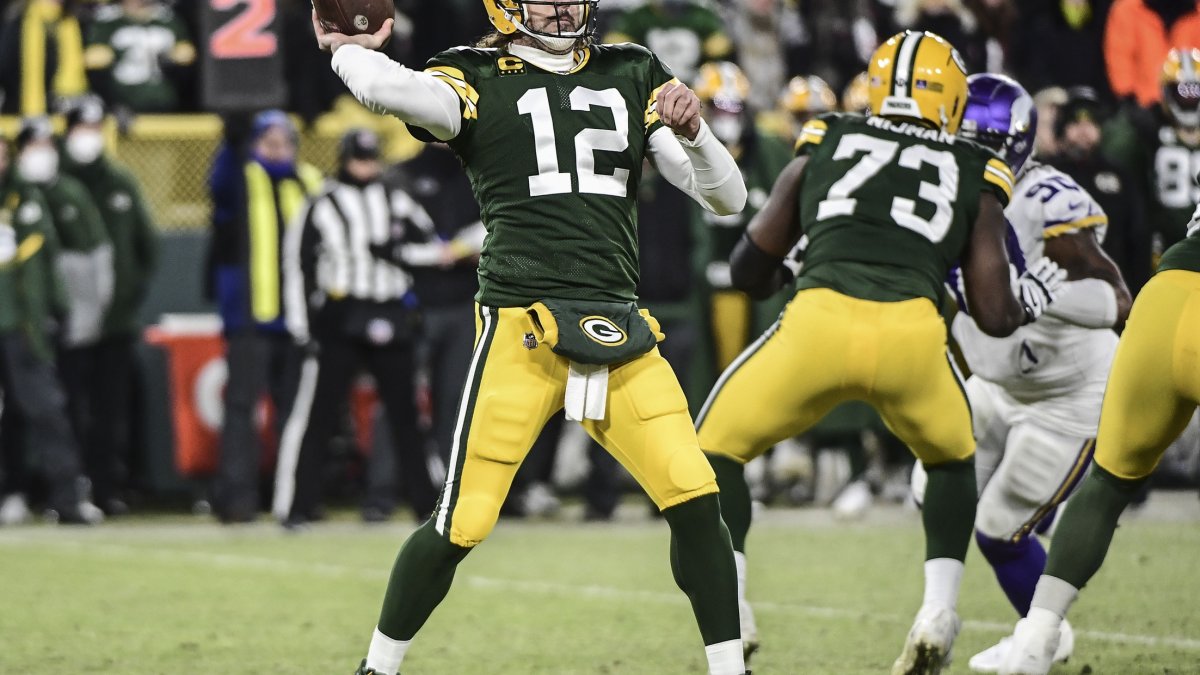
Last week, Bob McGinn, a long-time Green Bay Packers beat writer and observer, re-introduced the idea that Aaron Rodgers could be hurting his team by being too conservative. McGinn laid out his case as such:
“Bad interceptions are, well, bad. Then there are interceptions that are the cost of doing business for unselfish, competitive, stats-immune quarterbacks battling to make plays and lead comebacks until the bitter end. When a quarterback, especially one with a powerful, usually accurate arm like Rodgers, deliberately minimizes chances to deliver a big play for fear of an interception.”
Click here for more PFF tools:
Rankings & Projections | WR/CB Matchup Chart | NFL & NCAA Betting Dashboards | NFL Player Props Tool | NFL & NCAA Power Rankings
Best Bets Tool
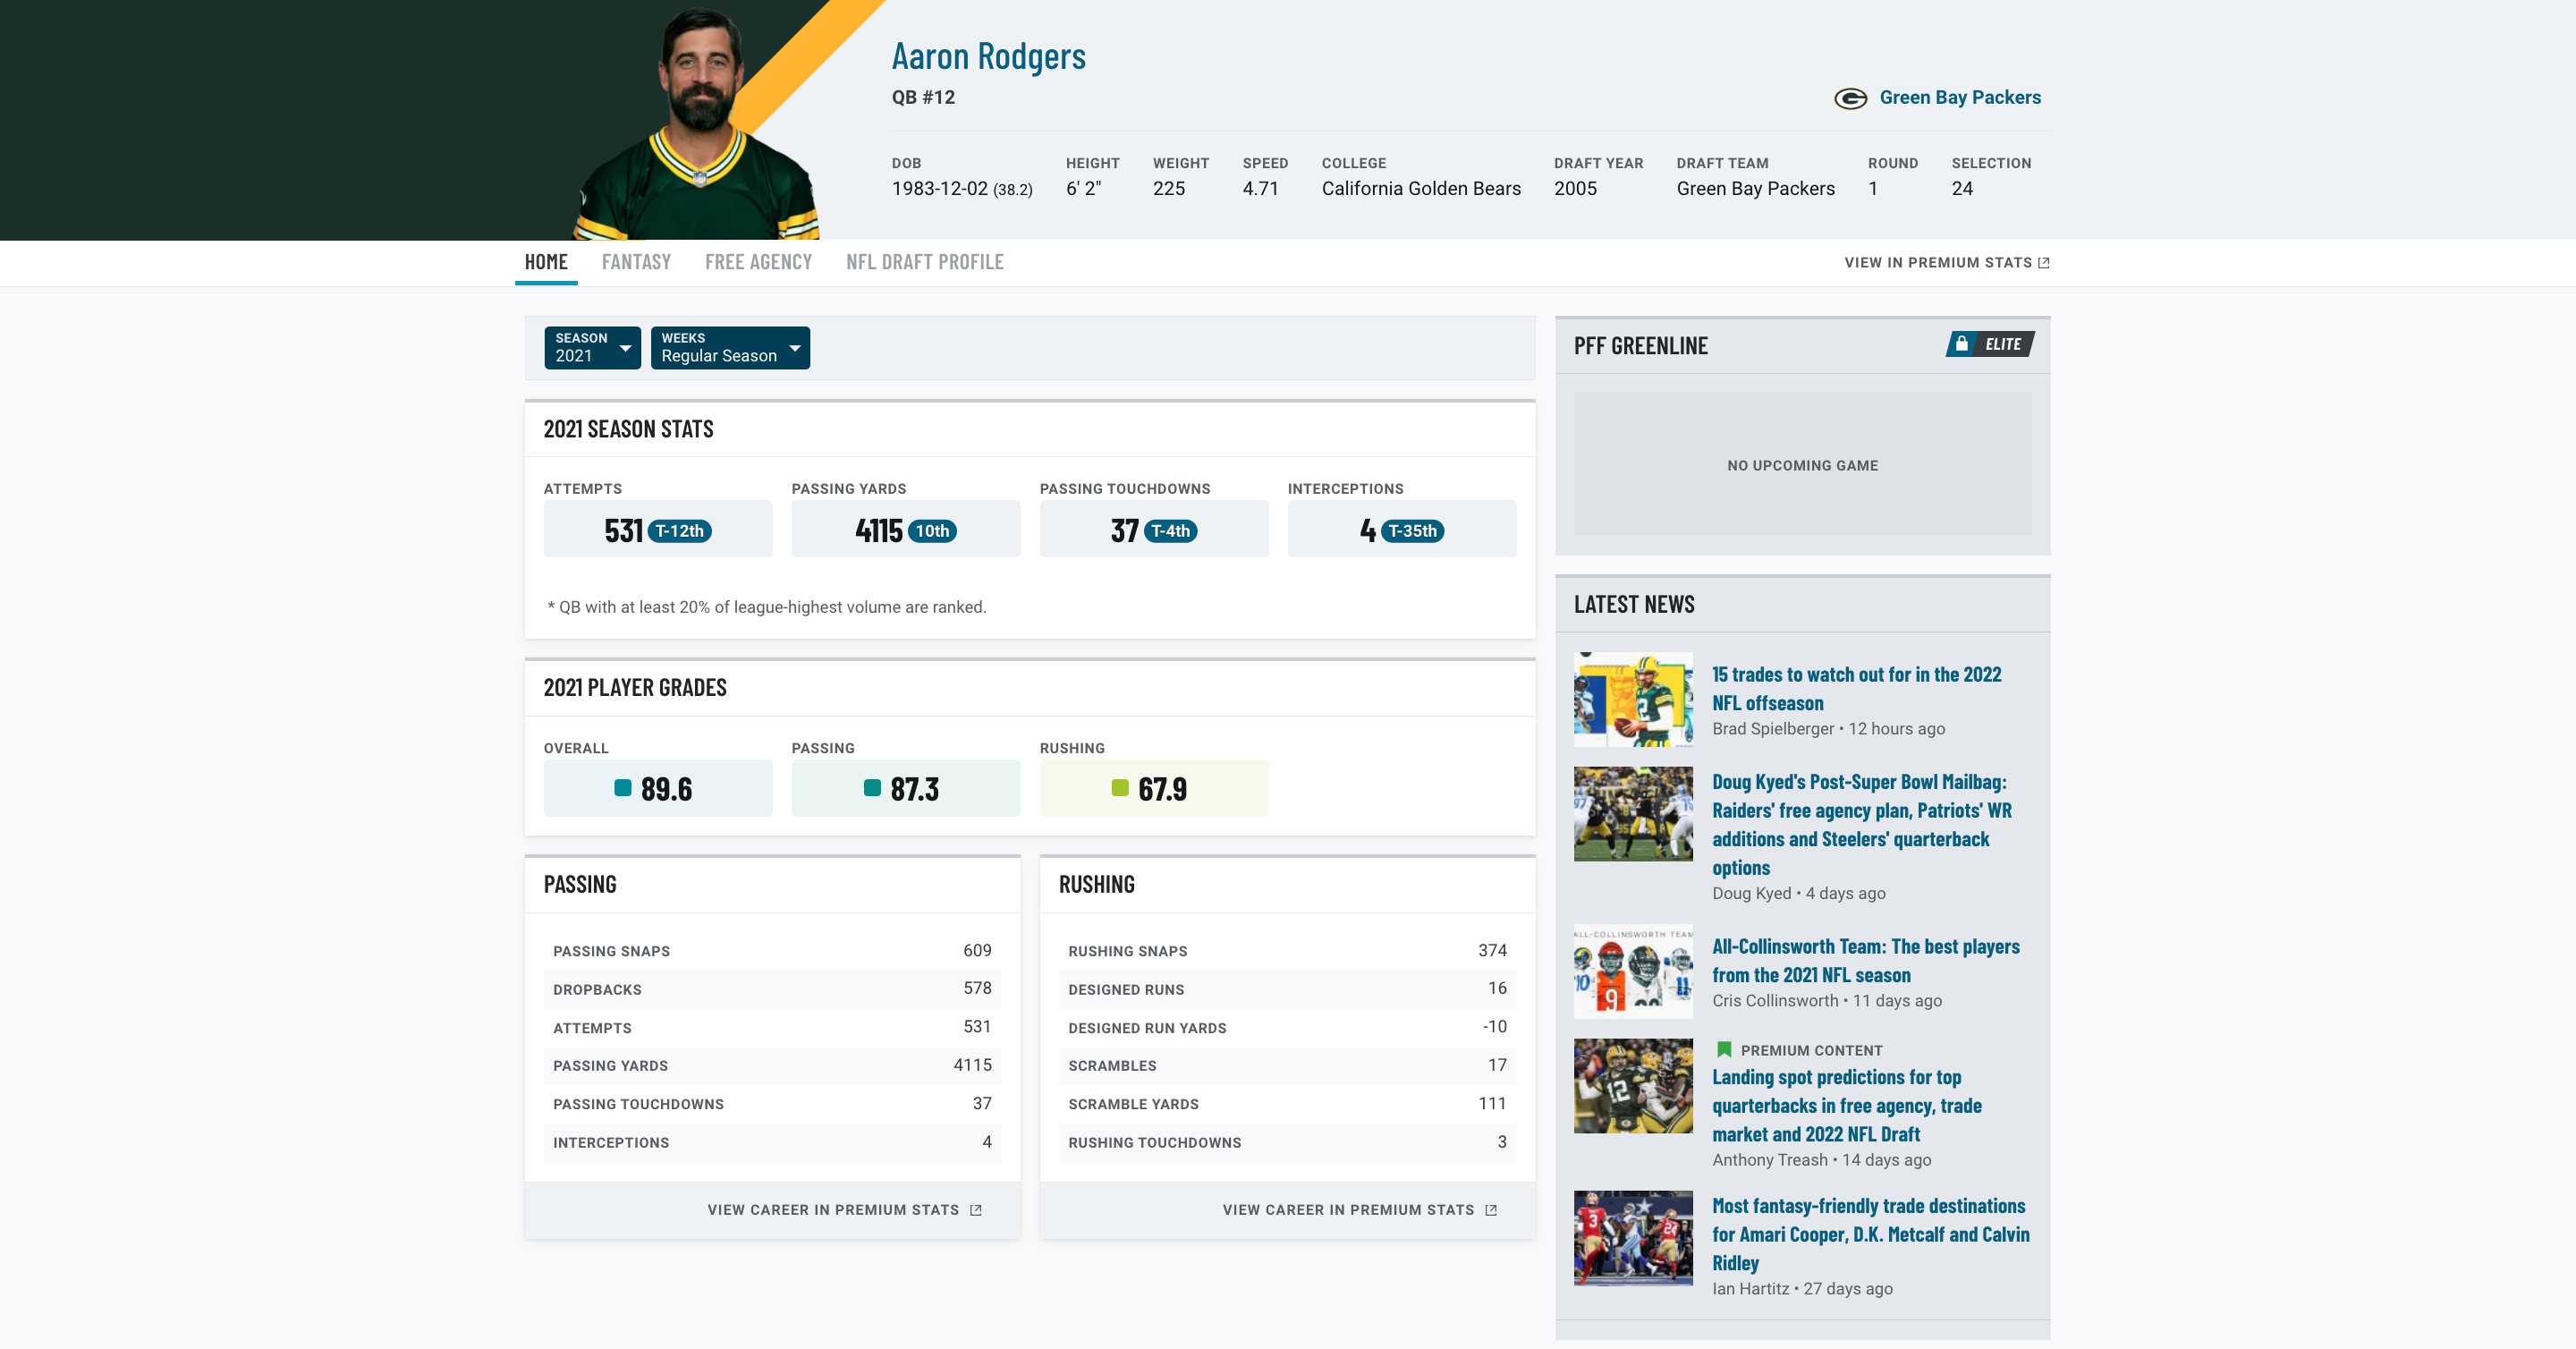
Rodgers posted an NFL-best 0.8% interception rate in the 2021 regular season, making it the fourth straight season that Rodgers has thrown fewer interceptions per pass attempt than any other quarterback in the NFL. On its face, the argument that a quarterback should throw more interceptions is absurd. Turnovers are the most costly plays for an offense in terms of expected points lost, and the plan should be, after all, to score as many points as possible.
However, superficially wrongheaded arguments can often reveal truths if we dig deep enough, and that’s what I intend to do in this analysis. There is a calibration of risk and reward at the quarterback position, which changes greatly as the situation dictates. Ideally, a quarterback wouldn’t take the same risk while leading by multiple scores near the end of the game, such as throwing the ball into coverage, as he would if he was trailing by the same amount. Aggregate seasonal stats are generally good for determining the quality of play, but they can mask contextual deficiencies, or strengths, in a player’s game.
Is Rodgers’ interception rate calibrated?
The first thing we can do is leverage the win probability data publicly available with NFLFastr to see how often Rodgers, and other quarterbacks, are throwing interceptions based on the game context going into the play. The win probability model looks past data and current team strength metrics to assess how likely a team is to win at any point and time based on a multitude of variables, including score, time remaining, current possession and field position.
Alongside Rodgers, I’m going to look at two great quarterbacks in Tom Brady and Patrick Mahomes to get an idea of how others calibrate their risk-taking. The trend lines below show their interception rates shift with their teams’ pre-play win probabilities, as all three threw more interceptions when they had a lower win probability.
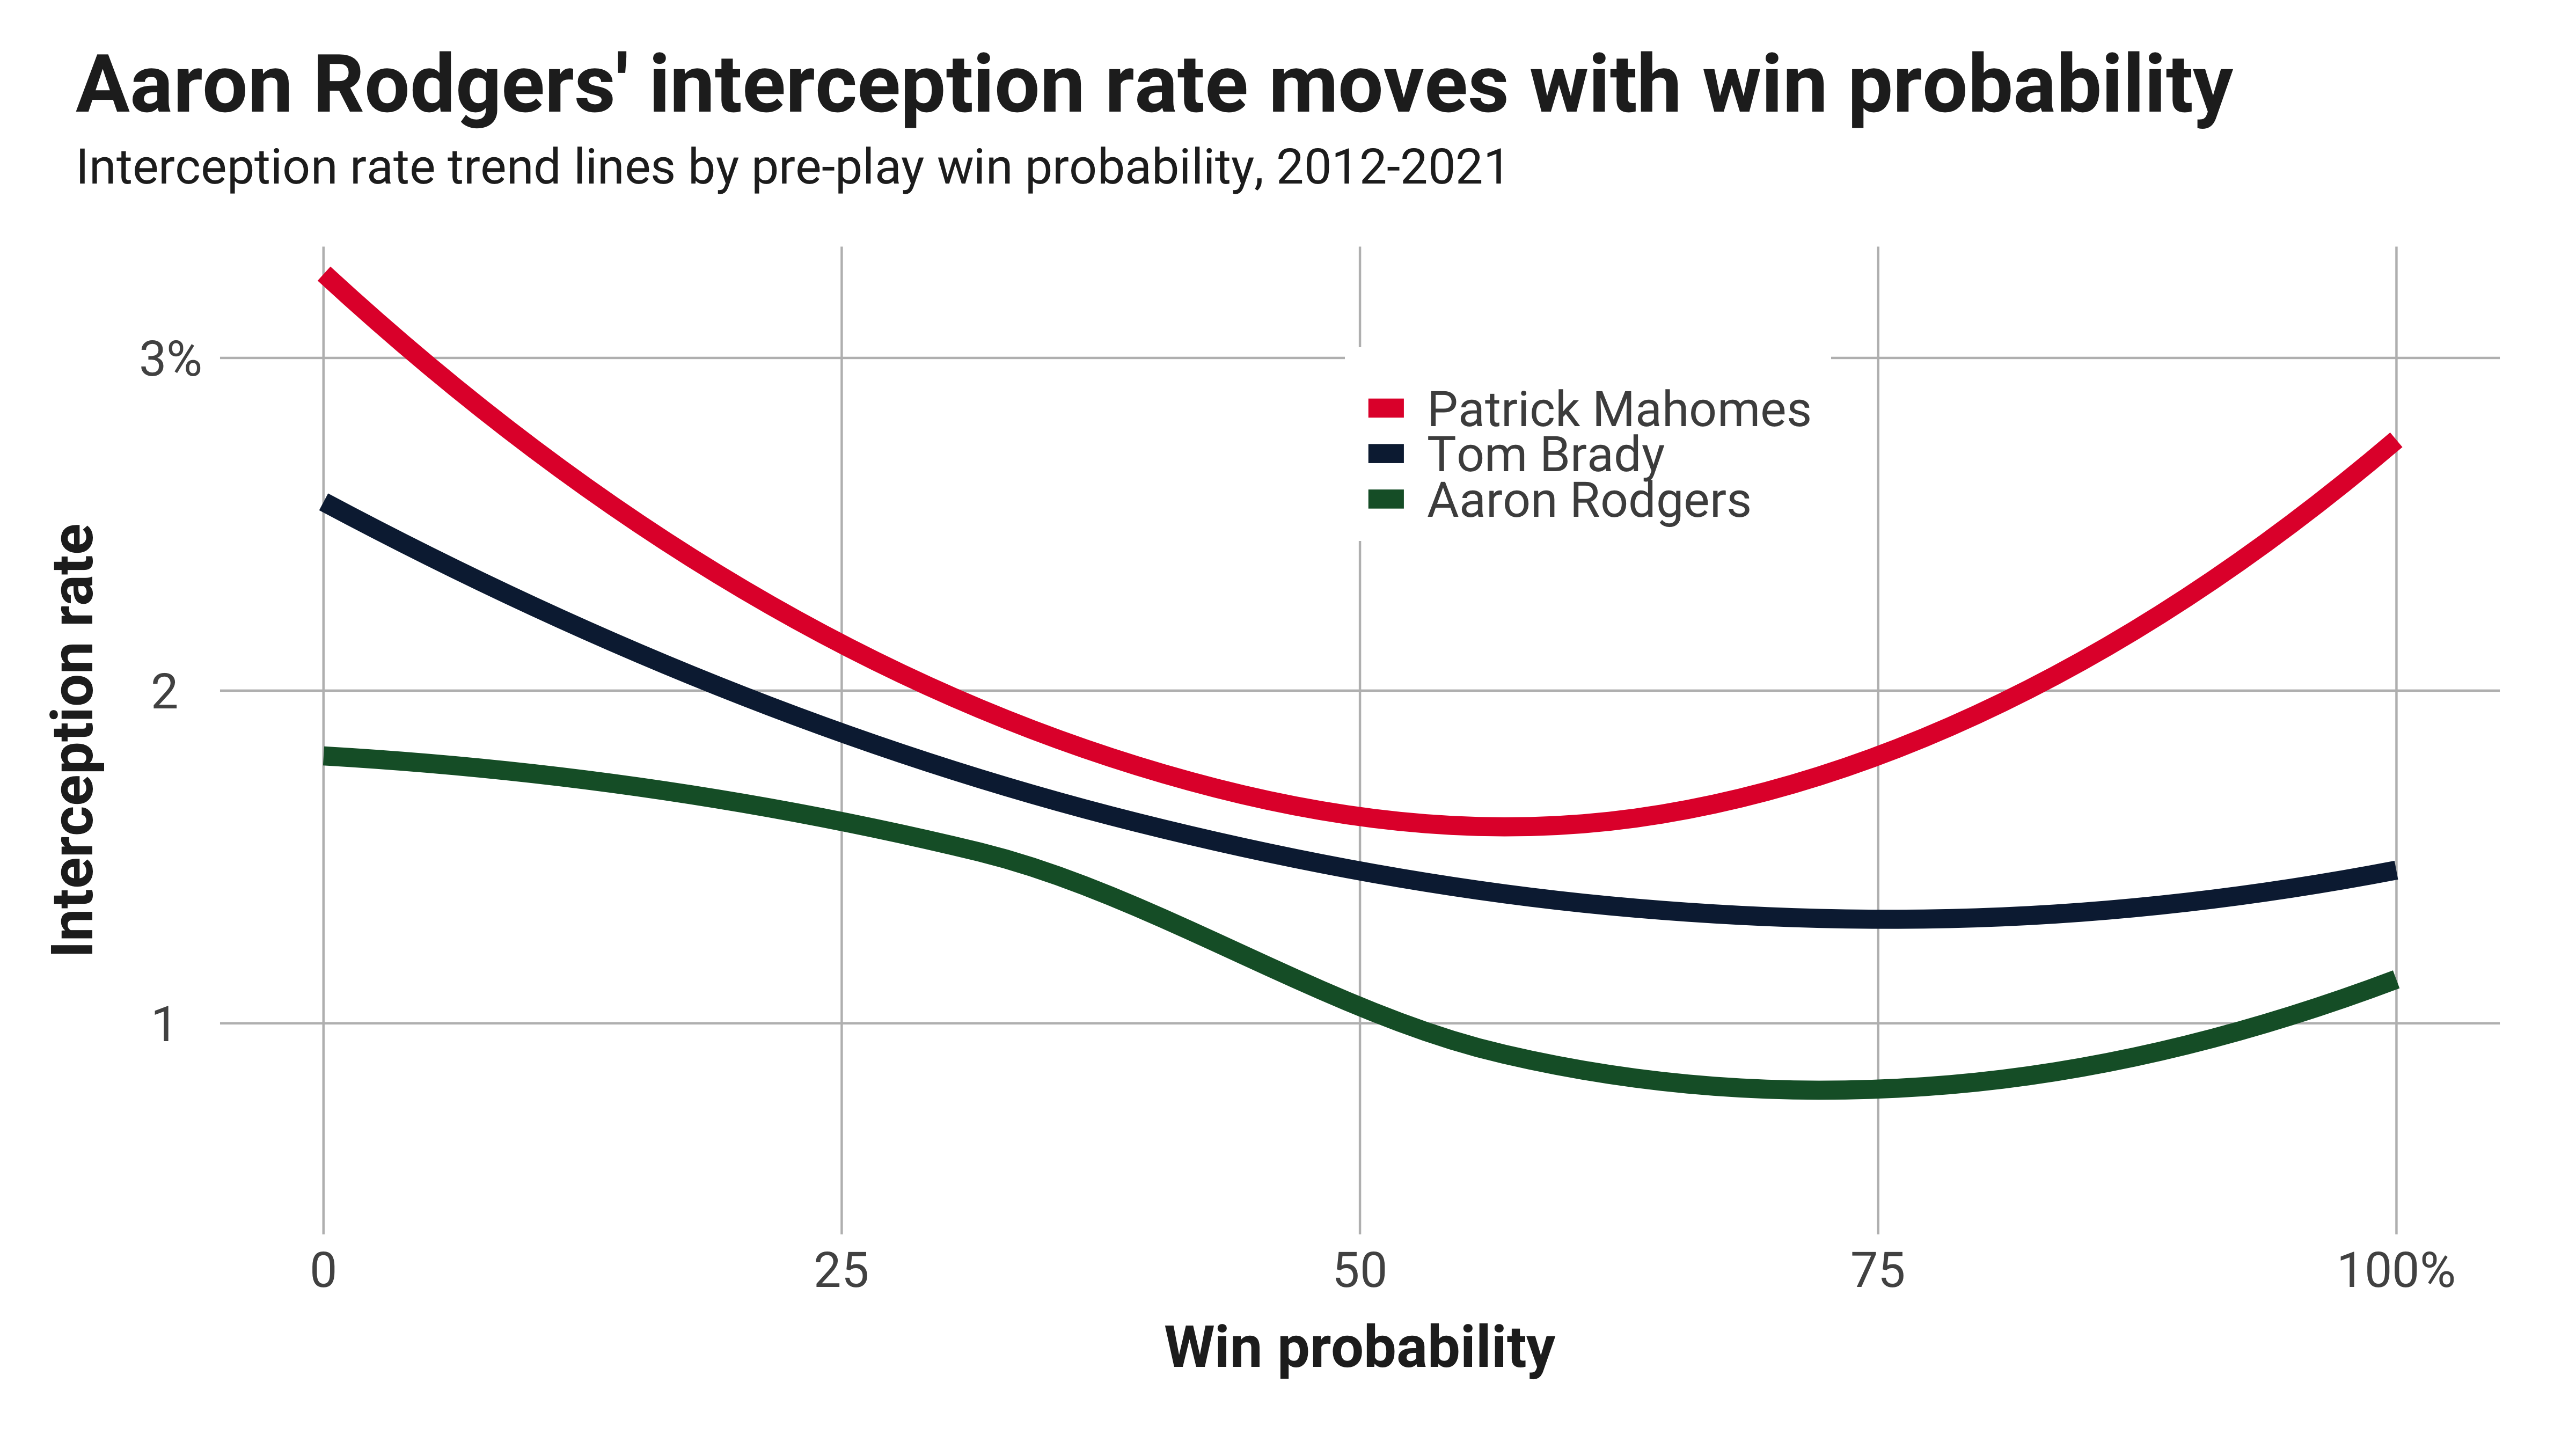
Rodgers looks fairly normal in comparison to his counterparts, recording a lower interception rate across the board. His interception rate flattens a bit more as it approaches 0% win probability but not drastically so.
Expected points added (EPA) per attempt, or the average points a quarterback is adding each time he passes the ball, is another measure of a quarterback’s overall play. If we plot EPA against win probability, Rodgers actually has the best EPA per attempt as his team approaches 0% win probability, whereas Mahomes and Brady dip, which is the case for most NFL quarterbacks.
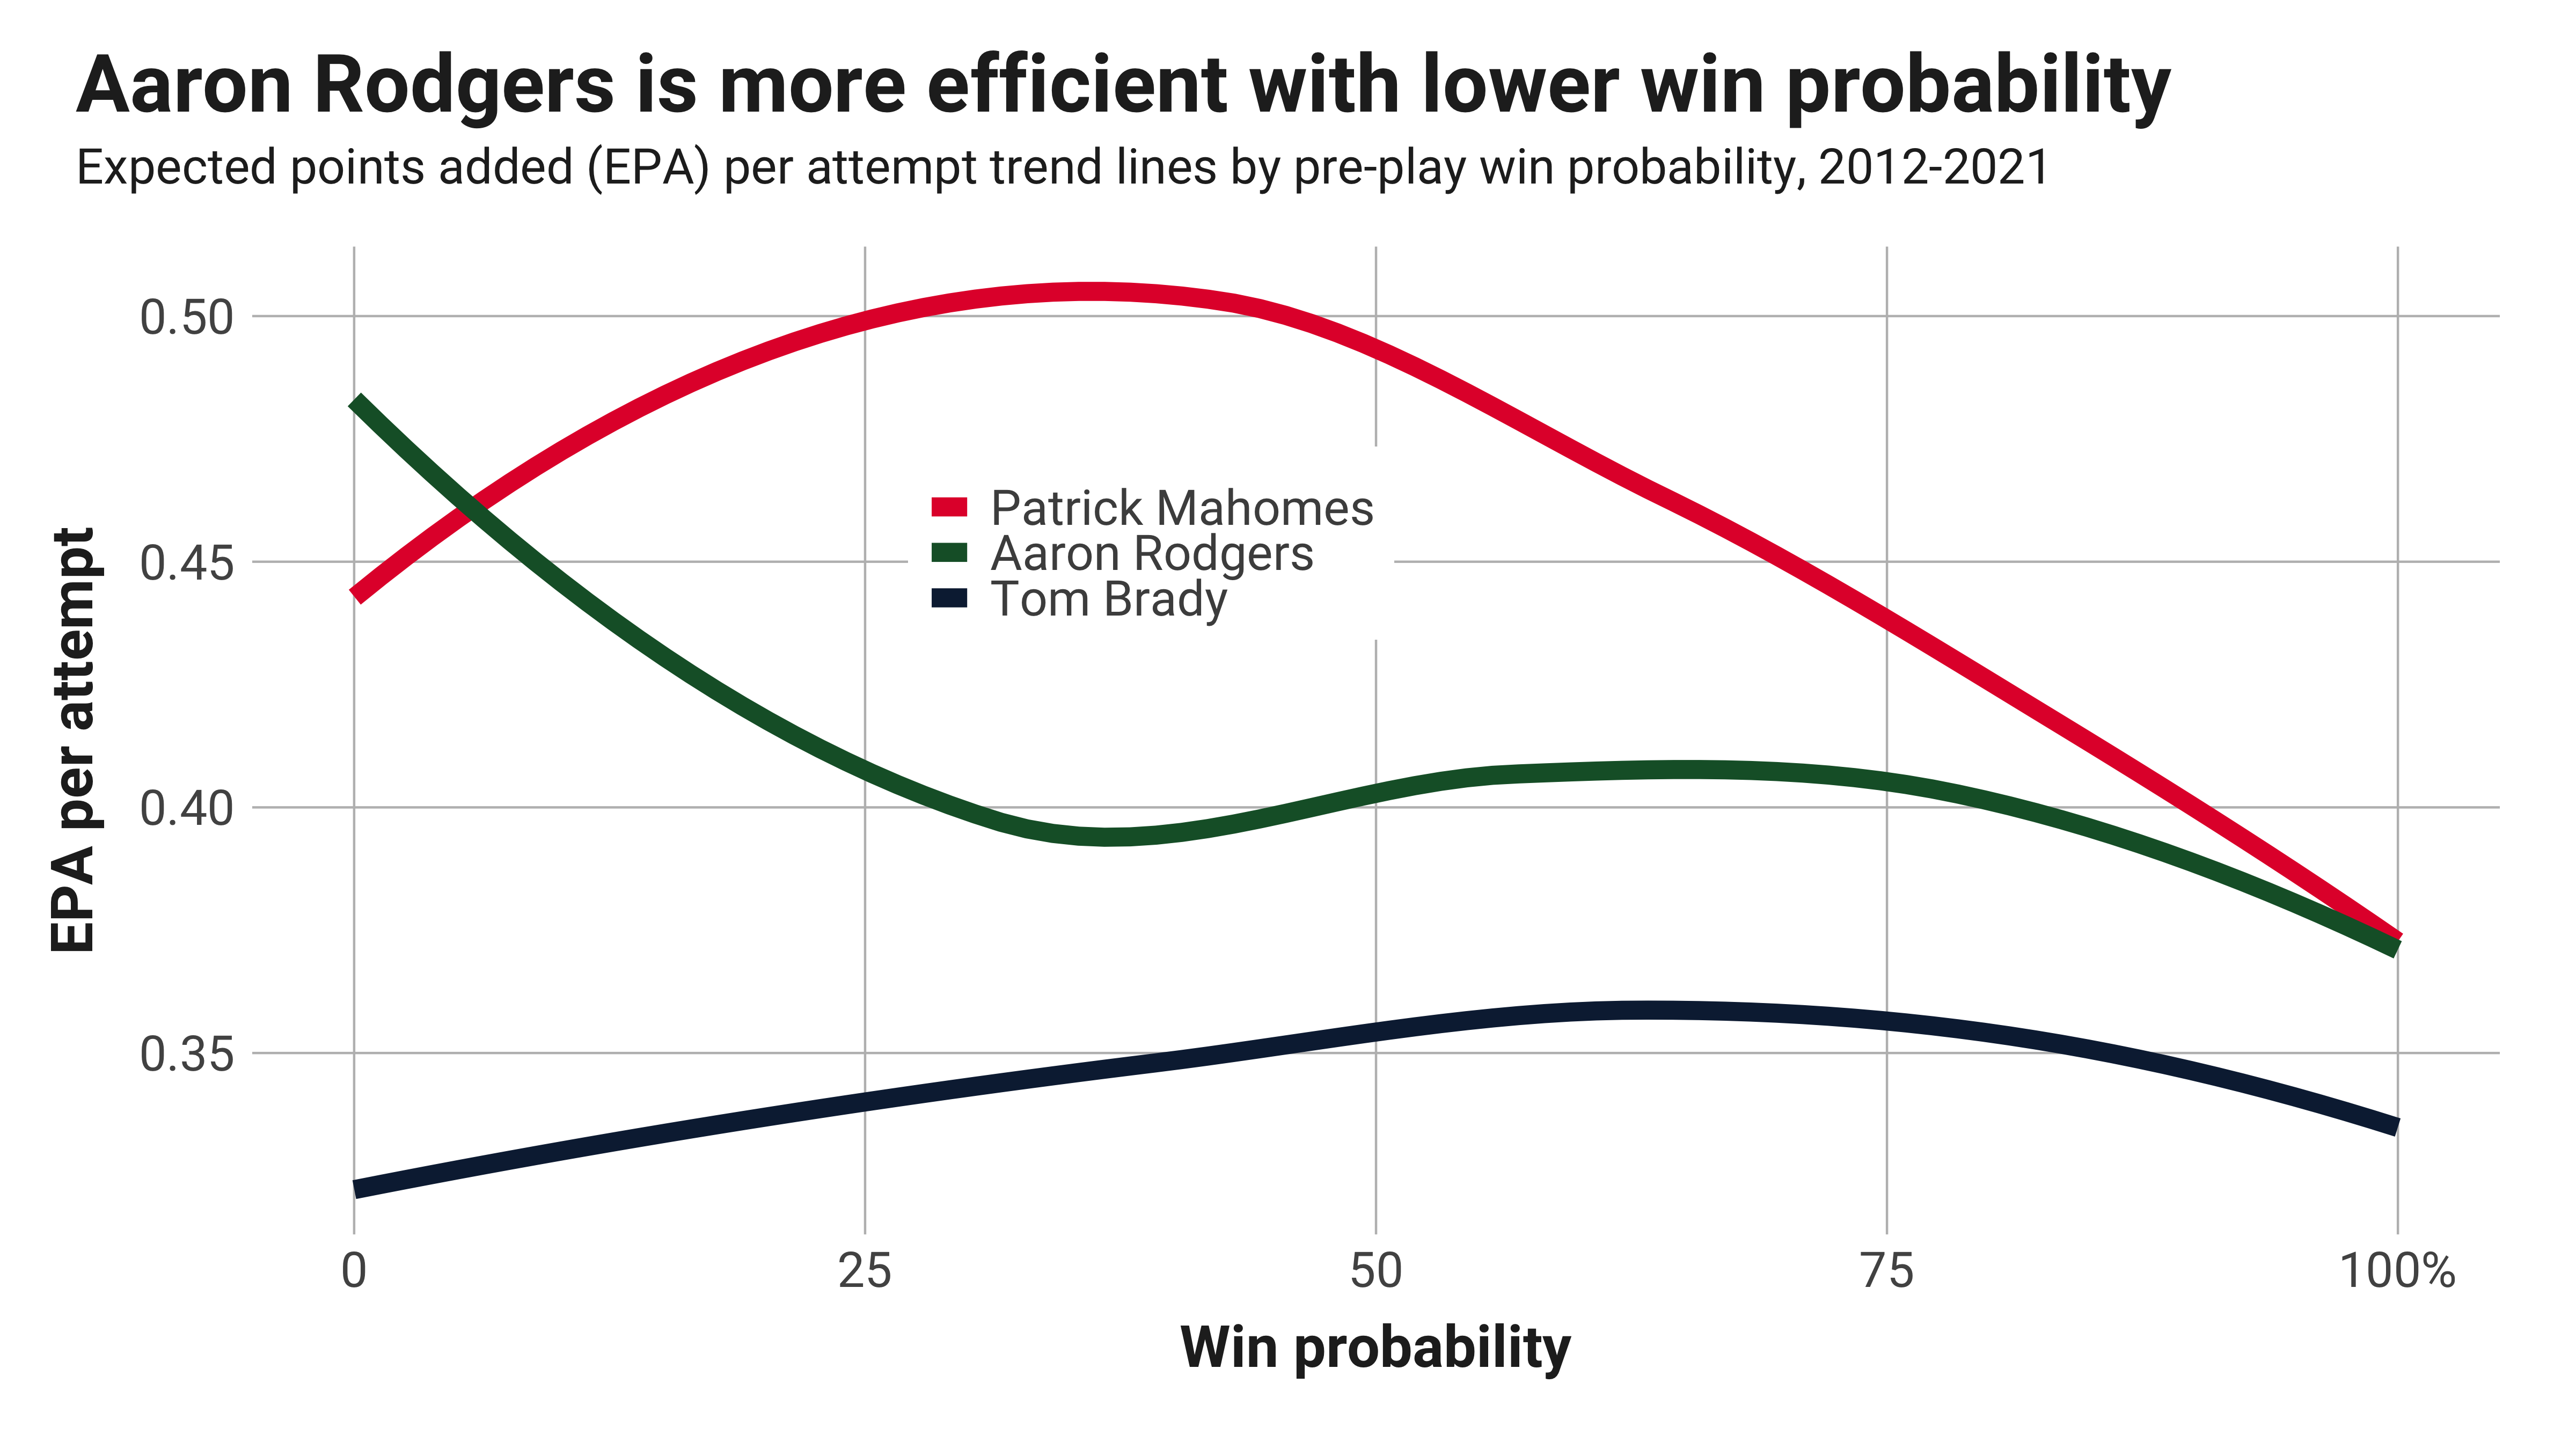
If Rodgers is seemingly taking on more interception risk and is more efficient than the others when trailing, there doesn’t appear to be a strong case that he’s being over-conservative when trailing and hurting his team’s chances in the biggest moments.
You play to win the game
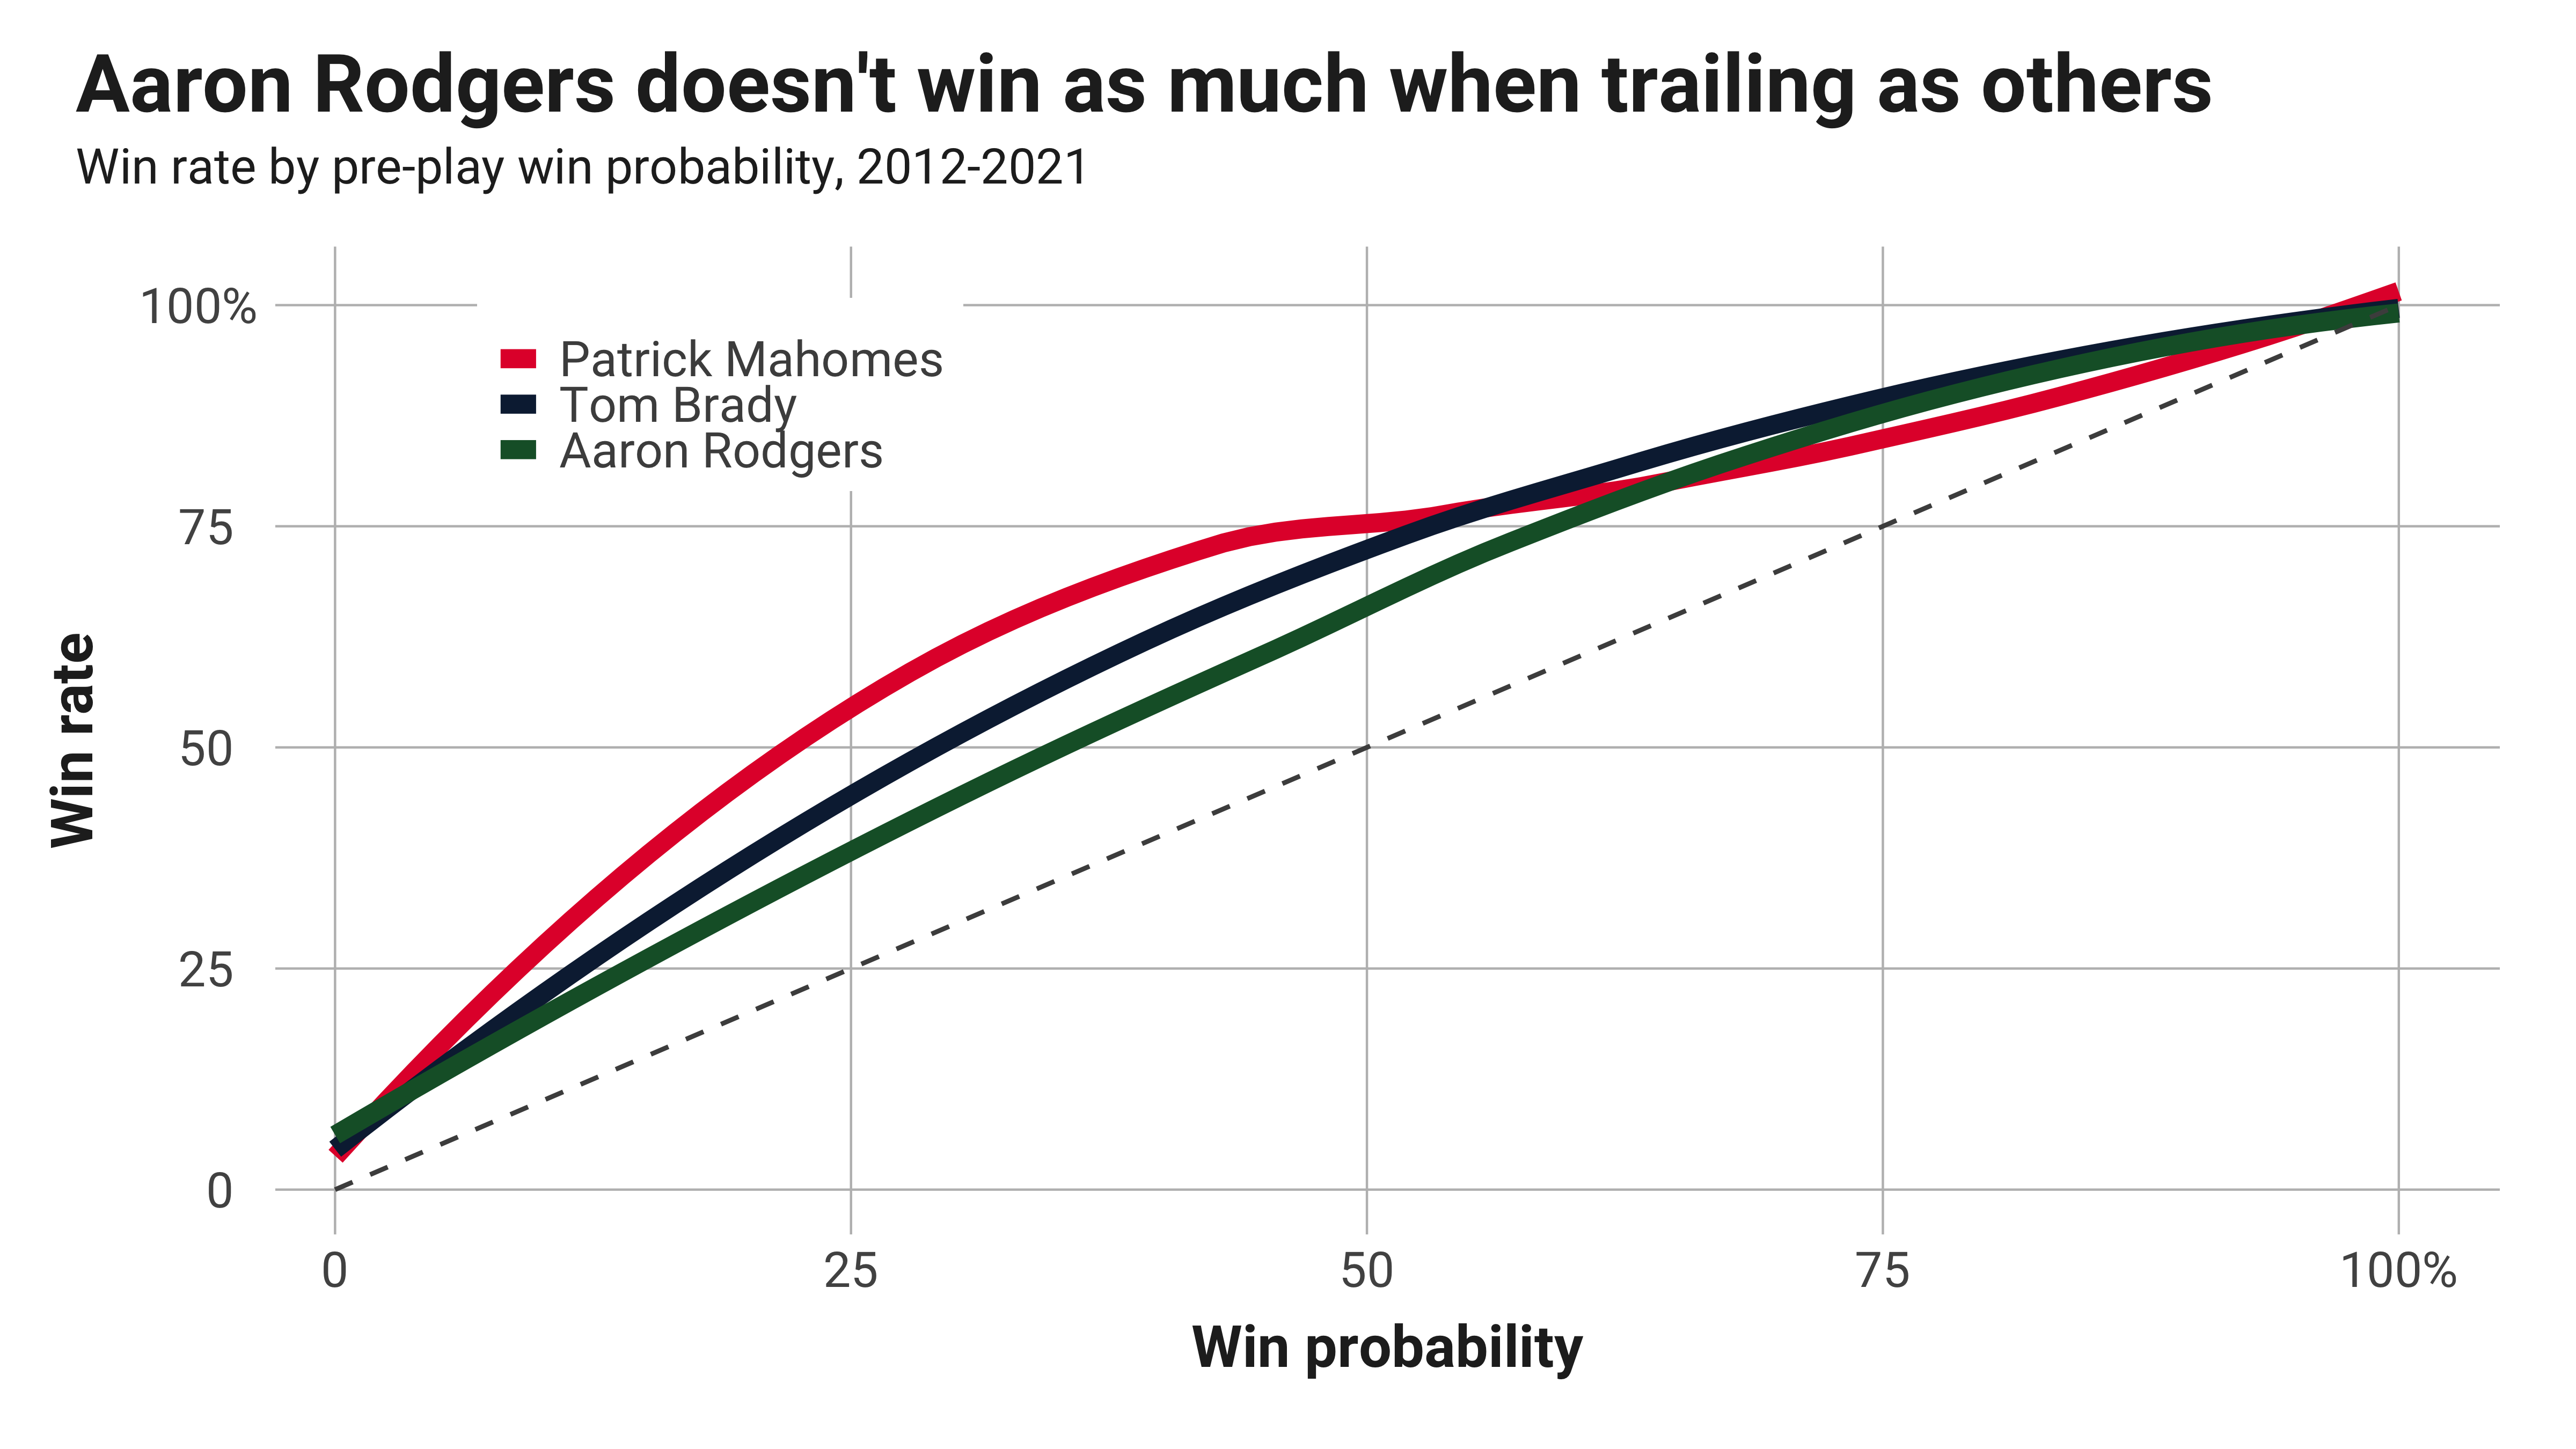
Interceptions and EPA per attempt are decent proxies for aggression and play quality, but they don’t specifically focus on the thing that matters most: winning the game. Showing that Rodgers has the best statistics when the situation is dire for his team doesn’t dispel the notion he’s too focused on statistics than winning.
Plotting each quarterbacks’ team by pre-pass win probability and whether those teams actually win the game reveals that Rodgers has had good, but not great, team success winning games when trailing.
Exclusive content for premium subscribers

WANT TO KEEP READING?
Dominate Fantasy Football & Betting with AI-Powered Data & Tools Trusted By All 32 Teams
Already have a subscription? Log in


 © 2025 PFF - all rights reserved.