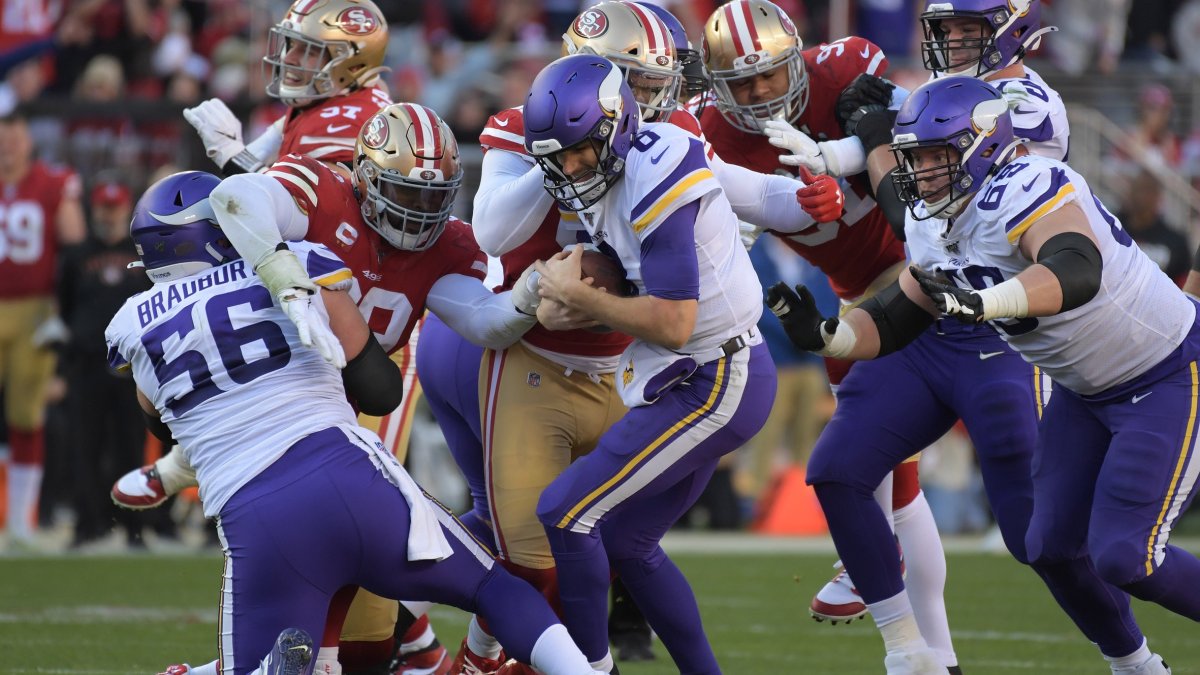
The San Francisco 49ers’ defensive line absolutely feasted on the Minnesota Vikings’ offensive line, consistently getting into the backfield and causing problems for Kirk Cousins. The Minnesota signal-caller was under pressure on more dropbacks than he wasn’t. That’s never a good sign for an offense, and it wasn’t a good sign for the Vikings in this one. They averaged under one yard per play when Cousins was pressured, significantly lower than the 4.5 yards per pressured dropback that they averaged during the regular season (sixth-best). Nick Bosa, Arik Armstead, DeForest Buckner and Dee Ford all got into the action with three or more pressures. That group is going to be a handful for opposing offensive lines, especially on third downs when the 49ers like to get them all on the field together.


![]()
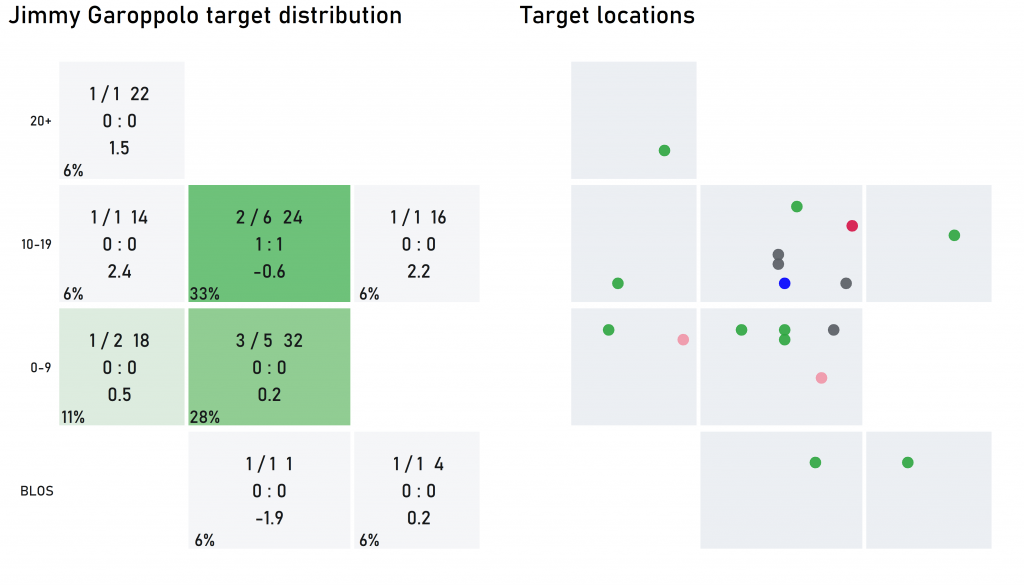
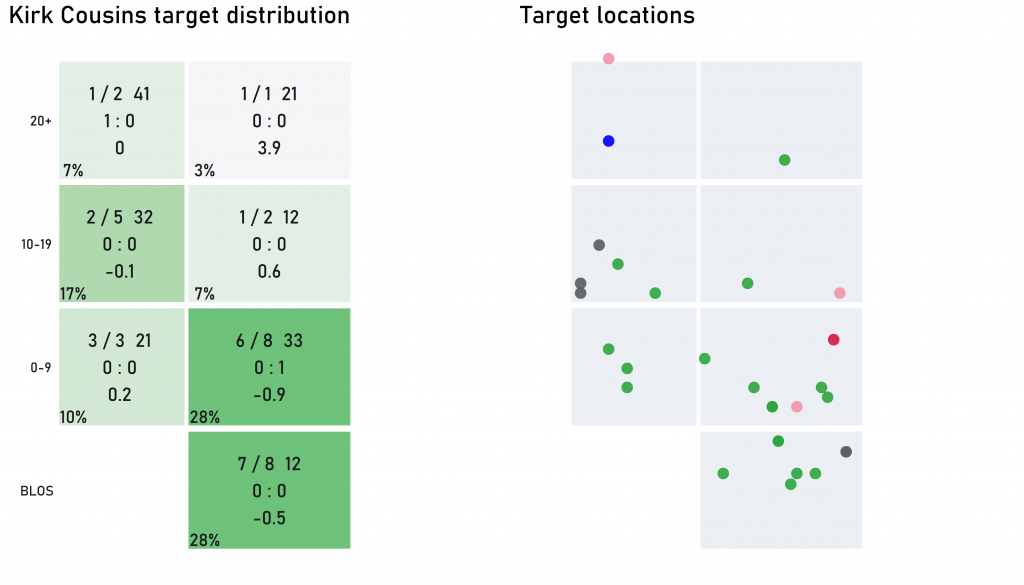
Passing Chart Takeaway
Cousins didn't throw a single pass outside the right numbers, the land known as Richard Sherman island. Garoppolo and the 49ers continued their M.O. of throwing 20-plus yards downfield at the lowest rate in the league but averaging the highest yards per deep pass attempt, throwing only one such pass and connecting on it.
If it wasn’t for Ahkello Witherspoon gifting Stefon Diggs a touchdown early on, things would have been even uglier for the Vikings’ offense. Witherspoon allowed 53 receiving yards into his coverage in the first quarter alone. Through three quarters – before the Vikings’ passing game picked up some yardage in garbage time – no other 49ers’ coverage defender allowed more than 10 receiving yards into their coverage. The run game wasn’t any kinder to the Vikings. They ended up with negative rushing yards before contact for the game. It was a comprehensive beatdown on that side of the ball.
| player | team | targets | tgt_share | air_yds_tgt | rec | rec_yds | rec_air_yds |
| Dalvin Cook | MIN | 8 | 29% | -1 | 6 | 8 | -7 |
| Adam Thielen | MIN | 7 | 25% | 8.1 | 5 | 50 | 39 |
| Stefon Diggs | MIN | 5 | 18% | 16.6 | 2 | 57 | 29 |
| Irv Smith Jr. | MIN | 3 | 11% | 9.7 | 3 | 39 | 29 |
| Kyle Rudolph | MIN | 3 | 11% | 5.3 | 2 | 4 | 1 |
| Ameer Abdullah | MIN | 1 | 4% | 3 | 1 | 7 | 3 |
| Tyler Conklin | MIN | 1 | 4% | -5 | 1 | 5 | -5 |
| Deebo Samuel | SF | 6 | 33% | 11.2 | 3 | 42 | 28 |
| George Kittle | SF | 5 | 28% | 5 | 3 | 16 | 3 |
| Kendrick Bourne | SF | 5 | 28% | 12.2 | 3 | 40 | 46 |
| Emmanuel Sanders | SF | 2 | 11% | 15.5 | 2 | 33 | 31 |
Target Chart Takeaway
The Vikings' most targeted receiver was Dalvin Cook, but his average target was -1.0 yards downfield. The 49ers' most targeted player, Deebo Samuel, was targeted an average of 11.2 yards downfield.
It was a completely different story for the 49ers’ offensive line against a talented Minnesota pass rush. Everson Griffen and Danielle Hunter made a very good New Orleans Saints’ offensive line look shaky up-front last weekend in the Wild Card game. Those two were held in check for the most part, and Jimmy Garoppolo had clean pockets to work from for much of the game. He was under pressure on just four of his 21 dropbacks for the game. Add in that the 49ers’ runners were able to pick up nearly two yards before contact per attempt, and it was a very impressive showing from the offensive line.
| tm | down_dist | plays | epa/play | suc_% | pass_% | epa/pass | epa/run | suc_%_pass | suc_%_run |
| MIN | 1st | 17 | -0.26 | 41% | 71% | -0.24 | -0.31 | 50% | 20% |
| SF | 1st | 31 | -0.19 | 52% | 26% | -0.65 | -0.03 | 37% | 57% |
| SF | 2nd_1-3 | 3 | 0.75 | 67% | 0% | 0 | 0.75 | 0% | 67% |
| MIN | 2nd_4-7 | 6 | -0.56 | 17% | 67% | -0.54 | -0.59 | 25% | 0% |
| SF | 2nd_4-7 | 12 | -0.04 | 50% | 8% | -0.89 | 0.03 | 0% | 55% |
| MIN | 2nd_8+ | 9 | -0.18 | 33% | 89% | -0.13 | -0.56 | 37% | 0% |
| SF | 2nd_8+ | 9 | 0.2 | 56% | 56% | 0.67 | -0.4 | 80% | 25% |
| MIN | 3/4_1-4 | 5 | -0.19 | 40% | 80% | 0.08 | -1.25 | 50% | 0% |
| SF | 3/4_1-4 | 8 | -1.07 | 25% | 38% | -1.63 | -0.73 | 0% | 40% |
| MIN | 3/4_5+ | 9 | -1.07 | 11% | 89% | -1.19 | -0.13 | 12% | 0% |
| SF | 3/4_5+ | 5 | 1.19 | 60% | 80% | 1.62 | -0.52 | 75% | 0% |
| MIN | all | 46 | -0.43 | 30% | 78% | -0.42 | -0.47 | 36% | 10% |
| SF | all | 68 | -0.07 | 50% | 31% | -0.05 | -0.08 | 48% | 51% |
EPA (expected points added): The amount that a play adds (or subtracts if negative) to the number of points the offense is expected to score on the next scoring play. Positive EPA represents a successful play (e.g. suc_%), EPA takes into account down and distance where yards per play does not.
EPA Chart Takeaway
The Vikings committed to the run game, but just 10% of their run plays got them closer to scoring (were deemed “successful”) compared to the 49ers, who were successful on 51% of their run plays despite simply trying to run the clock for most of the second half. The 49ers' run game was more explosive and efficient than the Vikings' passing attack.
Even with that offensive line success, the 49ers’ offense didn’t show a whole lot of the explosiveness that we’ve seen from them over the second half of the season. They didn’t need to, though. The Vikings’ offense was stagnant, failing to put together any semblance of a sustained drive for the entire game. That allowed the 49ers to just take advantage of several turnovers and lean on a running game that was successful on over 50% of it’s rushing attempts. That formula for victory likely won’t be that easy in the NFC Championship, but it was good enough for them against the Vikings.
[Editor's Note: All of PFF's grades and advanced stats from this game and the other games played this week will be finalized and made available to ELITE subscribers within 24 hours of the final whistle. ELITE subscribers can view player grades, advanced statistics, positional snap counts and more in Premium Stats.]


 © 2024 PFF - all rights reserved.