• Bet Jets-Browns O 39.5 (-110 BetMGM): Cleveland's True Score was 25.2 in Week 1; Jets top positive regression candidate (Week 1 True Score of 24.6.)
• Bet Broncos O 28.5 (-105 DraftKings): True Score of 26.3 nearly 10 more than actual because of fumbling and clock management.
• Bet Saints U 20.5 (+100 DraftKings): Saints are negative regression candidate in part because Bucs ‘D' posted NFL-best 3.9 True Score at Dallas in Week 1.
• New users who bet $10 or more at BetMGM will receive a free year’s subscription to PFF+ — a $79.99 value.

Because of the unpredictability and small sample size of NFL games, teams often end up with scores or results that aren’t sustainable. While the actual points a team scored is a fine start, True Score attempts to take out the flakiness of each game to create a metric that’s more predictive of future performance. We can use week 1 overreactions based on results to use True Score to find edges in game totals and team totals for Week 2.
BET: New York Jets @ Cleveland Browns Over 39.5 -110 BetMGM

We can see that in Week 1, only 9 of the 32 teams scored more than their True Score because of sloppy play and poor kicking performances.
• Browns Offense Did Well Against a Good Defense: The Browns had a True Score of 25.2 in Week 1 against a Carolina Panthers defense that ranked 7th in defensive EPA/play last year. The New York Jets ranked 32nd and are less talented and more susceptible to giving up points.
• Jets Offense Performed Better than Actual Output: Despite only scoring 9 points, the Jets had a True Score of 24.6 in Week 1 and are a top candidate for positive regression.
• Both Offenses Should Run a Lot of Plays: Both the Browns and Jets were top-5 in amount of plays run in Week 1 — with the Browns running 78 plays, the Jets running 84 plays.
• PFF’s Greenline betting tool has a 2.4% edge on the over.
BET: Denver Broncos Over 28.5 Points vs. Houston Texans -105 DraftKings

- Denver’s Offense was Explosive and Avoided Most Negative Plays: In Week 1, the Broncos were 11th in explosive play rate and 6th in bad play rate. Despite only scoring 16 points, they're in the top-right quadrant because their offense performed well for most of the game even if the actual scoring wasn't there. Because of that, they’re a candidate for positive regression in Week 2.
- Denver’s Fumbling was Fluky: The Broncos had a True Score of 26.3 points in Week 1 but only ended up with 16 points because of two fumbles at the goal line by both Melvin Gordon and Javonte Williams and bad time management at the end of the 2nd half, leading to a 64-yard field goal attempt instead of something more manageable. We could expect these fluky plays to positively regress in Week 2.
- Texans Defense was Lucky: While the Texans defense only gave up 20 points, the Indianapolis Colts had a True Score of 30.5 points, meaning Houston had some variance break its way to help on defense. The Texans might be in danger of regressing to the mean and reverting back to a defense that ranked 26th in the NFL last year.
BET: New Orleans Saints Under 20.5 Points vs. Tampa Bay Bucs +100 DraftKings

• Saints Scored More than They Should Have: The Saints had a True Score of 19.6 last week, signaling they over performed with 27 points. This is especially relevant considering they were playing an Atlanta Falcons defense that ranked 28th in EPA/play last year, not facing a Buccaneers defense that ranked 5th.
• The Buccaneers Defense Played Very Well: Although Dallas Cowboys QB Dak Prescott played one of the worst games of his career, earning a 37.4 PFF grade, and the Cowboys were banged up going into the game, the Buccaneers defense showed they are still one of the NFL’s most dominant defenses. They caused the Cowboys to have a 3.9 True Score, which was the lowest of the weekend.
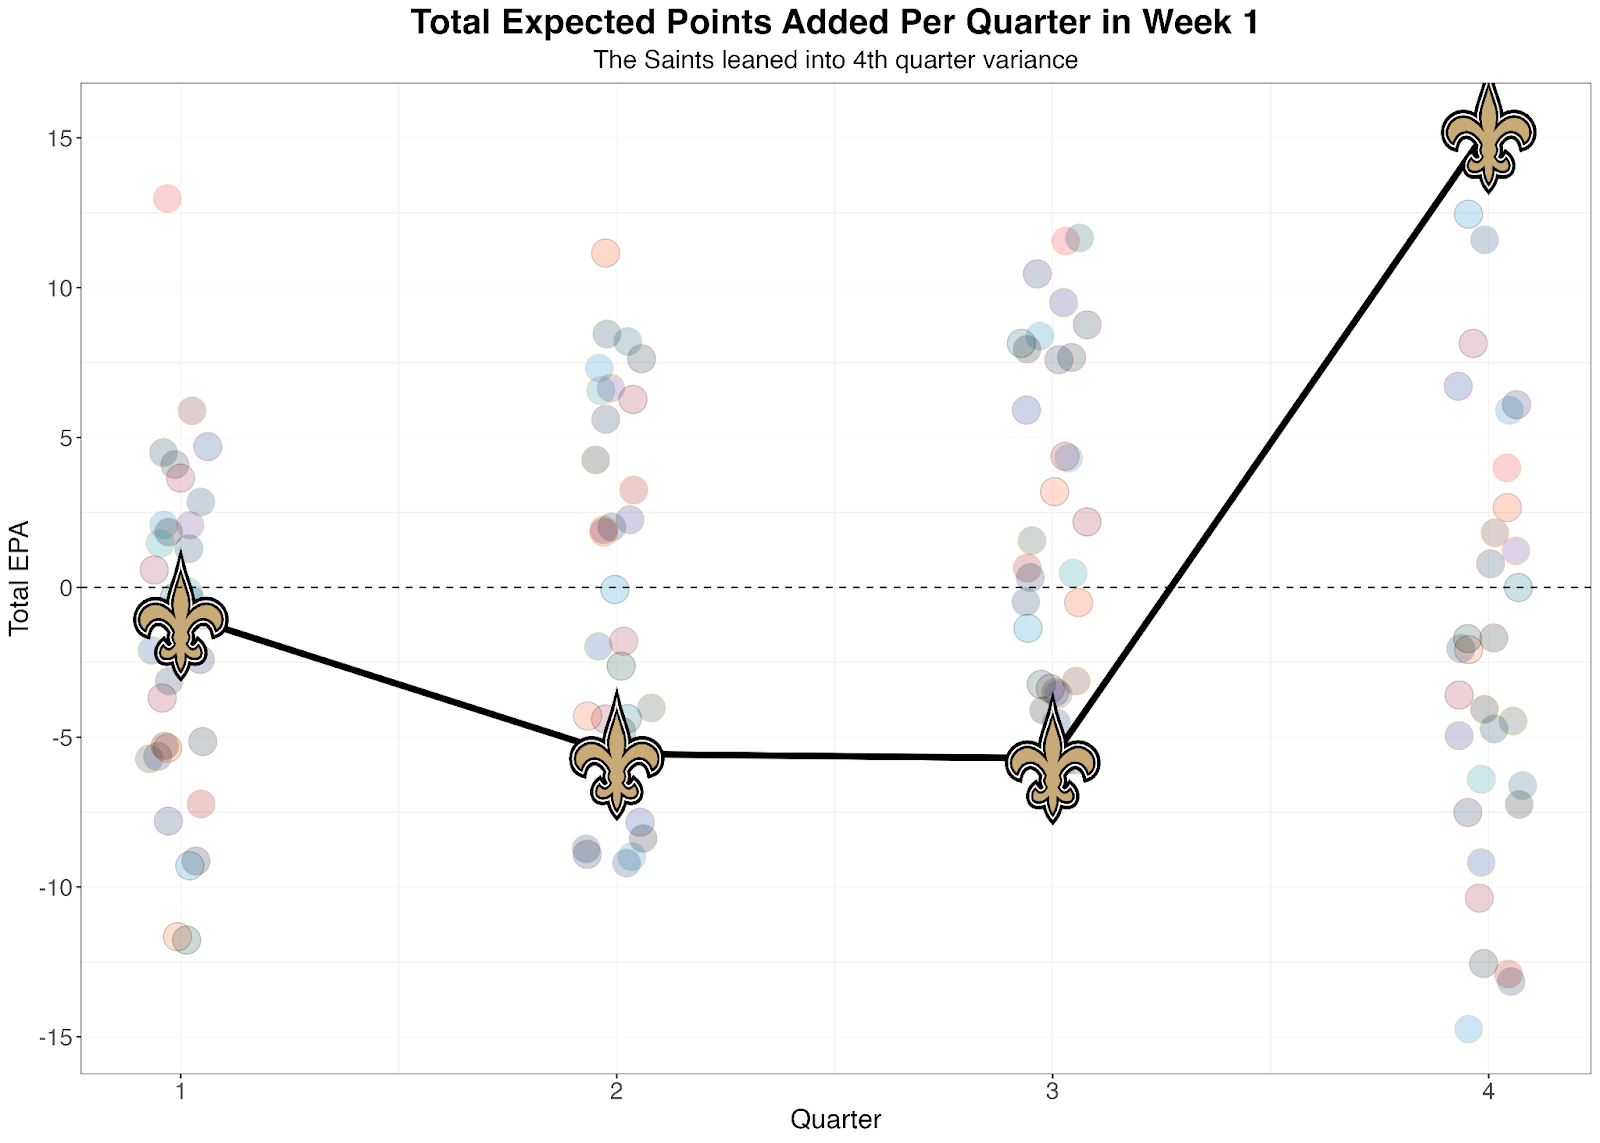
• The Saints Might Not be Able to Repeat the 4th Quarter Production: While the Saints ended up scoring 27 points, 17 of those came in the 4th quarter. Expected Points Added (EPA) shows this as they were a below-average offense through three quarters before being the best offense in the 4th quarter. This is probably not sustainable week-by-week, and we could see it regress as early as Sunday against the Bucs.
True Score was developed using Expected Points Added (EPA), explosive play rate (plays greater than 85th percentile), bad play rate (plays less than 15th percentile), success rate and total plays with era adjustments. in a XGBoost model. We can get what we would have expected the team to score with those statistics, taking out some of the variance. True Score is more predictive of future performance as it correlates with a team's future points scored with an R of 0.21 while actual points is at 0.17. We can also use it to help us beat game and team totals, as shown in this article.


 © 2025 PFF - all rights reserved.