A few weeks ago, we wrote about the difference between perfectly blocked plays and plays with at least one bad block in the running and the passing games. We found that the difference between perfectly blocked run plays and non-perfectly blocked run plays was much wider than passing plays, and when a run is perfectly blocked, it’s the best play on average in football. We talked about this on the PFF Forecast and the Cris Collinsworth Podcast that week.
Click here for more PFF tools:
Rankings & Projections | WR/CB Matchup Chart | NFL & NCAA Betting Dashboards | NFL Player Props tool | NFL & NCAA Power Rankings
So, what do we make of this information? Well, one of the first things we can do is look at which players have performed on perfectly blocked run plays and run plays with at least one bad block.
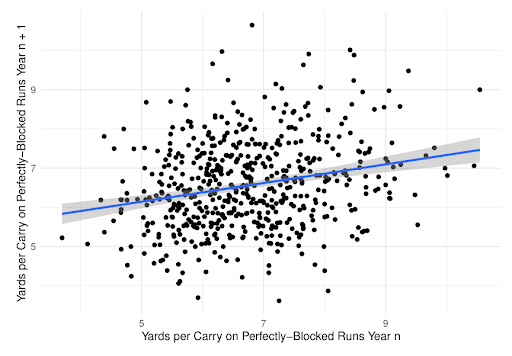
The first thing to look for in any data set is stability, and for running backs with more than 30 rushes on perfectly blocked run plays, year-to-year stability rings in at r = 0.238 (n = 564 players) from 2006-2021. Similar stability results hold for expected points added on such carries.

Exclusive content for premium subscribers

WANT TO KEEP READING?
Dominate Fantasy Football & Betting with AI-Powered Data & Tools Trusted By All 32 Teams
Already have a subscription? Log in


 © 2025 PFF - all rights reserved.