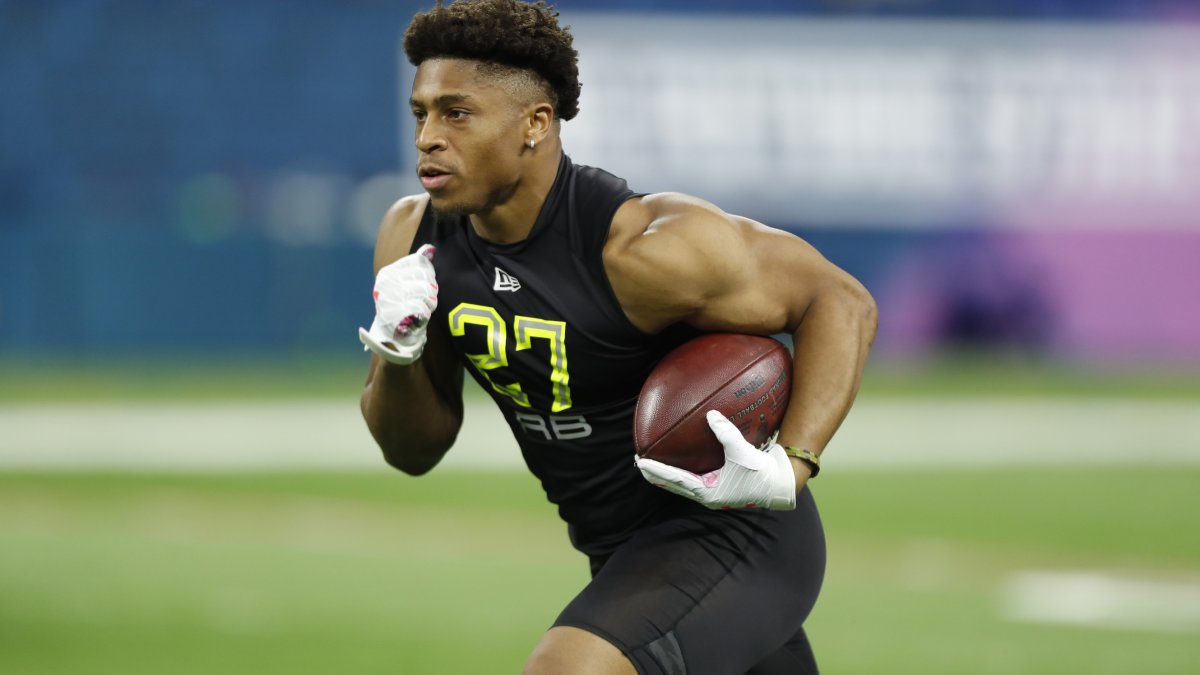
Now that the 2020 NFL Combine has been completed, it’s time to step back from the hype and assess the results. Luckily, we have an objective way to do this using the Combine models I developed last week for offensive and defensive players, which translate performances in each metric to movement in players’ draft positions and values — the latter based on PFF’s proprietary wins above replacement (WAR).
In this article, I’ll project every offensive player who participated in the 2020 NFL Combine in terms of percentile for draft position and WAR based solely on their Combine metrics. This will reveal who is most likely to jump in draft and on-field value. For most drills, strong performances have been more strongly linked to rising draft position than WAR, meaning NFL teams generally overvalue what we learn from the Combine drills.
Judging by the reactions to stunning Combine performance on social media, we’re likely also getting too caught up in how quickly players run in their underwear than how well they play on the field. We’ve already documented the Combine risers and fallers at different position groups; this analysis will do the same, but with a quantitative spin.
Methodology
This analysis is built on strong work from former Harvard Sports Analysis Collective member Bill Lotter in his series detailing why the NFL Combine actually matters. Lotter used ridge regression to estimate the coefficients for the different Combine results and measure their importance in explaining prospects’ draft positions and value — the latter estimated using Pro Football Reference’s approximate value (AV) over players’ first three seasons. My analysis is similar, but with PFF’s more sophisticated WAR metric as the target variable, not AV.
The plots below give the coefficients, derived from historical data from 2006-2017, for each measurement or drill denominated by standard deviation within the position group. The draft positions and WAR for position groups are translated to percentile, giving both the same scale.
Each bar below represents the amount of percentile movement you’d expect for a player with one standard deviation above or below the positional average. For timed drills, a negative coefficient is better. Lower times in the 40, three-cone and short shuttle generally translate to better draft positions and higher WAR over the first three seasons of a player’s career.
Below each plot, I have applied the regression models for draft position and WAR to all of the 2020 NFL Combine participants who recorded at least height, weight and ran the 40-yard dash. I used the recorded metrics and inputted those missing (discounted by half a standard deviation for skipping the drill) and produced a “Draft Score” and “WAR Score” for each player.
These scores are the projected percentiles (0-100) for draft position and WAR amongst the position group. The table is sorted first by PFF’s Big Board rankings, then by WAR Score. The last column indicated the difference between WAR and Draft scores, with negative differentials signaling players potentially overvalued after strong Combine performances, and positive differentials pointing to the opposite.
Exclusive content for premium subscribers

WANT TO KEEP READING?
Dominate Fantasy Football & Betting with AI-Powered Data & Tools Trusted By All 32 Teams
Already have a subscription? Log in


 © 2025 PFF - all rights reserved.