Tuesday, I put us as a drafting community to the test. This isn’t about how players do relative to their peers or their established standards, or their total fantasy points. No, this is just about how we do evaluating those players.
I tracked players’ positional ADPs (per Fantasy Football Calculator) the last five years compared to their end-of-season fantasy finishes. It was binary: Finish at or above your preseason ADP, you get a green mark. Finish below, you get a red. No qualifying ADP, black. It’s simple, but doing it that way keeps the lines and delineations clear. I call it the perception/production gap.
Here are the caveats, as established Tuesday:
- FF Calc only offers up quarterbacks and tight ends who were drafted often enough to be worthwhile, so those positions were generally limited to somewhere in the range of 20 names in a year. For running back and wide receiver, I went 50 deep, under the thinking that anyone taken after 50 is more or less a lottery ticket anyway.
- Obviously, this isn’t perfect. High-drafted players get penalized. A player who is consistently taken first at the position and finishes second gets a bunch of red marks, while a player consistently taken 40th and finishing 36th goes green. It’s not about building a fantasy roster entirely with green; it’s just about how our perceptions go.
- Because it’s binary (red or green), a player who is drafted 10th and finishes 11th gets the exact same credit as a player who is drafted 10th and finishes 110th. So we aren’t looking for nuance here.
- End-of-season fantasy-point total carry its own problem as a metric. A player who has three monster games and 13 so-so outings can finish higher than a player who has 13 decent games and three no-shows, and that doesn’t necessarily mean A was better than B.
Tuesday, I looked at quarterbacks and running backs. Today, it’s time to check out the notable takeaways from the other positions. Along with each name you’ll see the player’s six-year chart. If a quarterback was taken top-five or a running back went top-10, his ADP is noted. (Any deeper than that and I thought the ADP just clouded things instead of making them clearer.)
Antonio Brown, WR, Pittsburgh Steelers

I noted Tuesday how Adrian Peterson has failed to meet his ADP five years in a row, due in large part to his RB draft slot being obscenely high four of those years, and giving him a bit of a pass. Brown offers up the counterargument to that — he’s equaled or better his ADP four of the last five years despite being taken second and first in two of those years. In 2016, the year he missed is No. 1 ADP, he still finished as the No. 3 receiver.
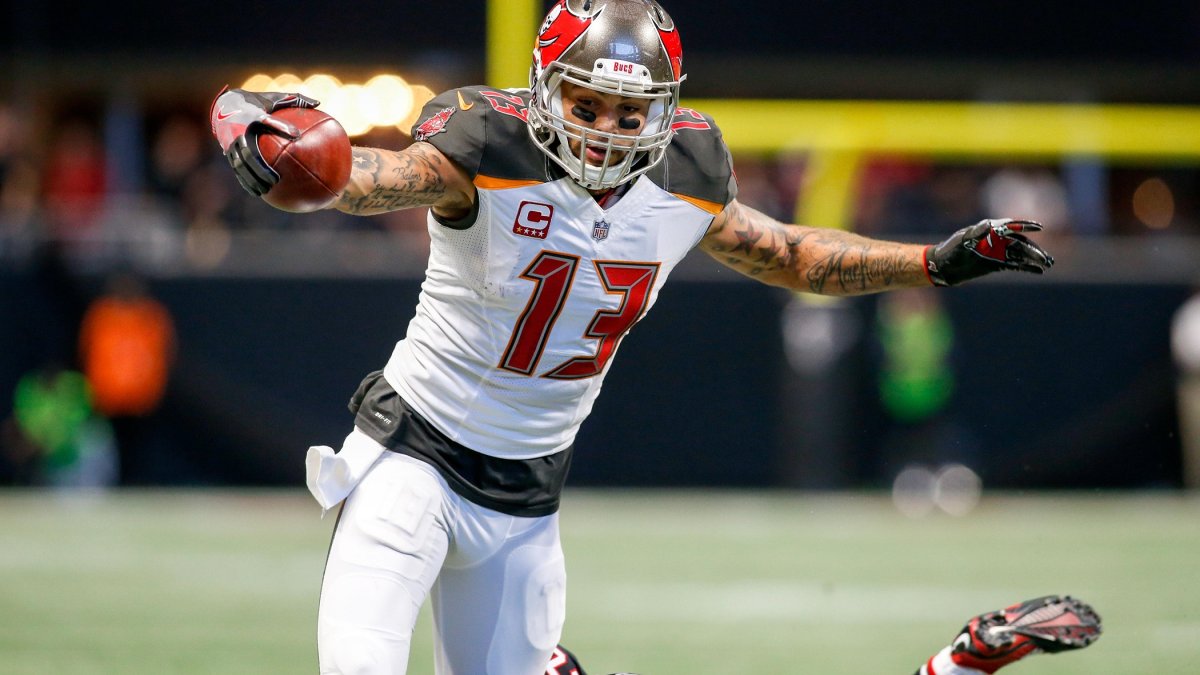
Mike Evans, WR, Tampa Bay Buccaneers

It’s only been a four-year career so far, but Evans is the platonic ideal of what I feel these charts should look like: We underrate a player, he overperforms, we overcorrect, he underperforms, and so on. The alternating nature of Evans’ chart makes the most logical sense, to me. He’s currently going eighth off the board in early ADPs, and if the perception/production gap continues, he’ll finish better than that in 2018.
Dez Bryant, WR, Dallas Cowboys

Bryant was the kind of player I was thinking of when I decided to do this. He’s still the kind of player we see and get excited about, despite ourselves. Despite that, he’s failed to return ADP value four of the last five years. A few other receivers like that:
- Alshon Jeffery, Philadelphia Eagles

- Demaryius Thomas, Denver Broncos

- Randall Cobb, Green Bay Packers

Beware the big-name receiver.
Amari Cooper, WR, Oakland Raiders

It feels unfair to call a receiver who has 2,903 yards and 18 touchdowns in three seasons a disappointment, but Cooper is one of only two active players on the list with at least three years of qualifying ADPs and only red on the chart (DeVante Parker is the other). Cooper’s early 2018 ADP has him as the No. 18 WR, but with Michael Crabtree expected to be back in Oakland in 2018, he might struggle to return value yet again.
Rob Gronkowski, TE, New England Patriots

Like Brown, Gronkowski shows that just because a player has a crazy-high ADP, he doesn’t have to be a disappointment. He’s been drafted in the top three at the position every year of our sample, and yet he’s equaled or better than ADP four of the six times. The years he missed value were injury years, with 8 games played in 2016 and 7 in 2013.
Greg Olsen, TE, Carolina Panthers

Olsen feels like the perfect “fifth- or sixth-best tight end.” When he was going late in drafts, early in our sample, he was a value. Then people started to believe in him and took him third three years in a row — and he’s failed to meet value all three times.
Julius Thomas, TE, Miami Dolphins

Thomas is the ultimate “coasting on his big name” player in fantasy in recent years. He had a couple really strong seasons in Denver with Peyton Manning as his quarterback (24 touchdowns in 27 games in 2013 and 2014), then left the Broncos. Since then, he’s had 12 total touchdowns in 35 games, with 1,124 yards across three seasons. But memories of those big-score seasons keep Thomas appealing to fantasy owners. It remains to be seen if Thomas will land somewhere in 2018, but barring just a perfect situation, he’s an obvious avoid.


 © 2025 PFF - all rights reserved.