Chip Kelly became the head coach of UCLA this offseason, and that means that pace-of-play discussions will be limited mostly to the college game in 2018. However, pace and pass vs. run ratio remain relevant topics for professional football and provide the foundation for most systematic sets of projections and rankings. I had dipped my toes in these research waters before — mostly because of Kelly back when he coached the Eagles — but as I started to do so comprehensively in recent days, I discovered that the calculus is much more complicated than the Kelly narratives would have led one to believe.

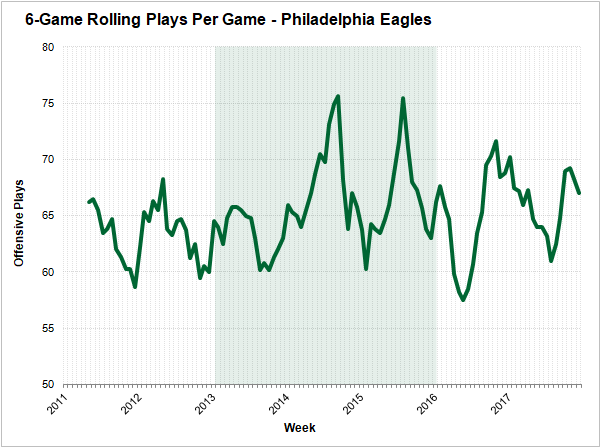
Kelly joined the Eagles back in 2013 — his tenure is shaded green in the chart — and although he made no immediate impact on the team’s rolling totals of pass and run plays, those totals crept up to a pair of unprecedented peaks north of 75 plays per game in 2014 and 2015. Had the timeline stopped there, one could reasonably conclude that Kelly alone drove the team’s increase in pace. However, in the two years since Kelly left the Eagles, the team has enjoyed another peak and has remained routinely above the pace of the pre-Kelly Eagles. Is new head coach Doug Pederson coincidentally another driver of pace, or is there another reason — perhaps Carson Wentz’s development — that explains the maintenance of the team’s increased play volume?

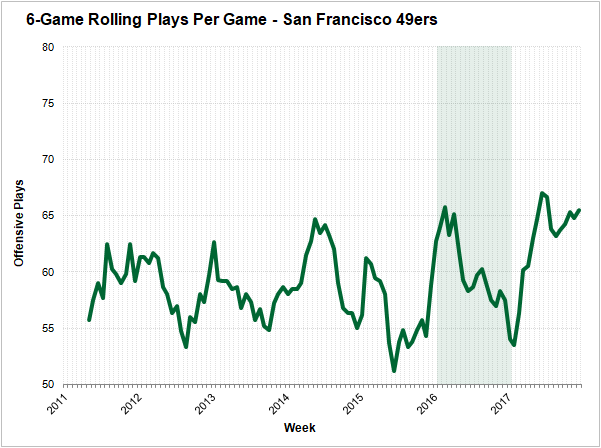
Kelly coached the 49ers after he left the Eagles, and his impact on pace there fell short of what it did for his old team. Perhaps he needed more than one season, the way he did with the Eagles. Either way, notice how the 49ers’ rolling total of plays per game centered on 60 plays per game rather than the Eagles’ 65 plays per game even without Kelly’s influence. So is it somehow the team — perhaps because of the efficiency of its offense and defense — that is responsible for play pace rather than the coach?

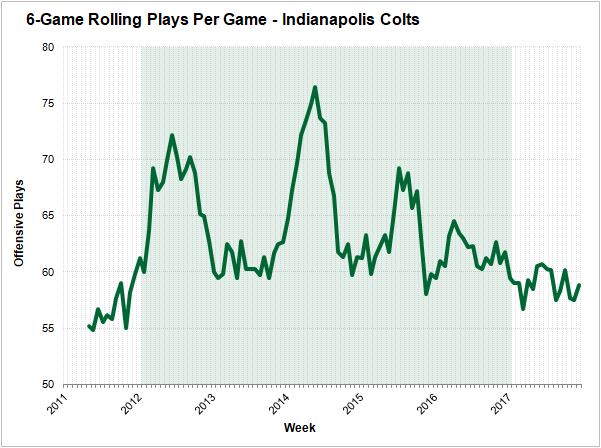
I thought maybe the Colts could demystify things because they have had five years with Andrew Luck and one year without him on both the front and back ends of the last decade. But even in Luck’s healthy seasons, the team’s rolling totals of plays per game varied wildly.
The reality is that snap pace is a complex issue, and it’s very difficult to decouple one actor’s influence from another’s. In recent seasons, quarterbacks, head coaches, and offensive teams themselves have each produced very similar year-to-year correlations in their total of plays per game, between 0.43 and 0.47. Even defensive teams exert some influence over pace of play, showing a year-to-year correlation strength of 0.28.
| Snaps Per Game Year-to-Year Correlations When Entities Remain the Same |
||
| Entity | Sample Size | Correl |
| Off Team | 254 | 0.43 |
| Head Coach | 206 | 0.44 |
| Quarterback | 164 | 0.47 |
| Def Team | 254 | 0.28 |
Moreover, coefficients remain tightly compacted for each of the quarterback, head coach, and offensive team when you run correlations across offseasons where one actor changes and another stays the same. For example, plays per game for offensive teams who change primary quarterbacks correlate with 0.39 strength. And quarterbacks who play for different head coaches share that same 0.39 correlation.
| Snaps Per Game Year-to-Year Correlations When One Entity Remains the Same and Another Changes |
|||
| Same | Different | ||
| Off Team | Head Coach | Quarterback | |
| Off Team | – | 0.38 | 0.39 |
| Head Coach | * | – | 0.31 |
| Quarterback | * | 0.39 | – |
| *Limited Sample Sizes | |||
Those consistencies are bad news for writers on the hunt for scapegoats for changes in a team’s style of play, but they are actually good news for projection design. Since both the quarterback and head coach exert a similar influence on their team’s consistency in play volume, an algorithm can rely on a team’s recent pace to project its future pace as long as either of those main actors is still with the team.


 © 2025 PFF - all rights reserved.