As we did prior with wide receivers, this article examines fantasy football opportunity for rookie running backs. The implied rushing and receiving production for running backs based on their collective average draft positions (ADPs) should be roughly equal to the total output for the backfield in our projections.

Assuming the single backfield projection is more accurate than those for a collection of running backs, large differences in projections can mean a couple of things: Current running backs are misvalued, or there is an underlying assumption the NFL team will add additional running backs in the draft.
It’s the second of those conclusions I’m exploring in this piece, using ADP to find teams with weaker collective backfield ADP than those of our projections, thereby identifying which teams have the most opportunity for rookie additions at running back. In addition to mismatched value, I’ll be using a concept that originated in economics that Football Perspective’s Chase Stuart applied to receiving shares — called the concentration index.
The final metric for judging rookie running back opportunity — each team’s opportunity score — combines the mismatches in projections for team backfields and ADP implied numbers for running backs with the concentration indexes, where less concentrated carries among current running backs means more opportunity.
CONCENTRATION INDEX
In this analysis, we're using the concentration index to measure how much NFL teams' top running backs dominate the share of fantasy point value in current best-ball drafts. The less dominant a team's top running back is, the more room there is for a new rookie to steal share from weaker competitors.
The concentration index quantifies the degree of concentration by squaring fantasy ADP values and then adding them together. In a simple example, if a single running back got 100% (of a ratio of 1) of the total fantasy ADP in current best-ball drafts (as we see below) and the rest zero, the squared sum of the ratios is one, the highest possible concentration index. If another team’s ADP value in recent best-ball drafts was equal to four running backs at 25% (0.25 ratio), the squared sum of the ratios is 0.25.
Below are the percentages of ADP value for the top three running backs on the teams with the highest concentrations in the NFL. In this table, the “concentration” is the squared sums of the running back ADP values multiplied by 100.
| Team | RB1 Share | RB2 Share | RB3 Share | Concentration |
| Steelers | 100% | 0% | 0% | 100 |
| Jets | 100% | 0% | 0% | 100 |
| Giants | 98% | 2% | 0% | 97.4 |
| Titans | 95% | 5% | 0% | 94.7 |
| Saints | 92% | 6% | 2% | 91.2 |
The concentration index does a good job of quantifying our understanding of the teams that would provide the least opportunity for a rookie running back to take over a workload portion from their teammates. For the Pittsburgh Steelers and Tennessee Titans, it’s obvious lead backs Najee Harris and Derrick Henry aren’t likely to give up shares of the backfield carries. For others like the New York Jets, the appearance of a lack of backfield competition is deceiving, but we’ll add other measures to the opportunity score formula below to offset that misperception.
On the flip side, the teams with the lowest concentration of carries for top running backs are the ones we want to identify as great landing spots for rookie running backs. Those squads are in the table below, and they are the ones who will score higher in the final opportunity score calculation, which also includes the mismatch in projected backfield production and that implied by player ADPs.
| Team | RB1 Share | RB2 Share | RB3 Share | Concentration |
| Patriots | 53% | 40% | 7% | 45.4 |
| Eagles | 60% | 35% | 5% | 48.9 |
| Chiefs | 56% | 42% | 2% | 49.1 |
| Browns | 61% | 35% | 4% | 49.5 |
| Dolphins | 60% | 39% | 1% | 50.7 |
The New England Patriots and Cleveland Browns probably don’t provide as much opportunity as the concentration index indicates, but the look at total production assumption versus projection below will eliminate the Browns and Patriots as top teams with so high of expectations built into their running backs ADPs. On the other hand, the Philadelphia Eagles, Kansas City Chiefs and Miami Dolphins are getting the correct signal from the concentration index, with those backfields relatively wide open for a new addition in the form of a higher draft pick.
PROJECTION MISMATCH
Using current best-ball ADPs from best-ball leagues, we can derive the implied fantasy points based on the broader relationship between our running back projections and ADP. Below is a plot showing our projections for running back fantasy points plotted against current ADPs.
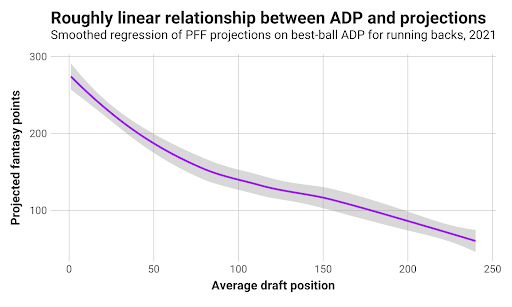
The relationship between projections and ADP is roughly linear, as is expected. We can use this relationship to then work backward and derive fantasy points expectations for each running back based on their ADP.
It’s counterintuitive that ADPs would provide more meaningful fantasy points expectations than projections themselves, but the key difference is how the two systems operate. Most fantasy points projections systems, including ours at PFF, take the total running production for each team and divide 100% among currently rostered running backs. ADPs, on the other hand, don’t need to match in the same manner.
If drafters are skeptical of a team's current running backs, their implied fantasy points based on ADP will not match that of the team’s backfield projection. We can harness this mismatch to identify teams where the projected production for running backs is higher than the expectation for ADP, thereby finding teams with openings for a new rookie running back to take production.
For each NFL team, I calculated the implied fantasy points for the top four running backs based on their ADPs, adding 15 or 30 implied fantasy points to the total for teams with only two or three running backs who have current ADPs in best-ball drafts. When comparing those totals to our projections for running back projections on the same teams, the running back groups furthest under projection are in the table below.
| Team | Implied FP | Projected FP | Diff |
| Bills | 185.8 | 335.7 | 149.9 |
| Falcons | 234.5 | 305.7 | 71.2 |
| Jets | 225.5 | 285.5 | 60.0 |
| Texans | 201.4 | 255.5 | 54.1 |
| Seahawks | 267.6 | 310.5 | 42.9 |
The Buffalo Bills have been linked to Breece Hall in the first round, and that would be a smash hit for fantasy purposes if it comes to fruition. None of the Bills’ running backs has a positional ADP in the top 35, and it should be one of the NFL’s most productive offenses in 2022. The Atlanta Falcons have Cordarrelle Patterson as their lead back, but there’s still opportunity for a rookie to contribute heavily. However, our projections might be overvaluing a Marcus Mariota-led offense.
BRINGING IT TOGETHER
By scaling and bringing together the concentration index and the mismatches in fantasy production, we can derive a single number for measuring the opportunity for a rookie running back to join a team and be highly productive. I’m calling this measure the opportunity score.
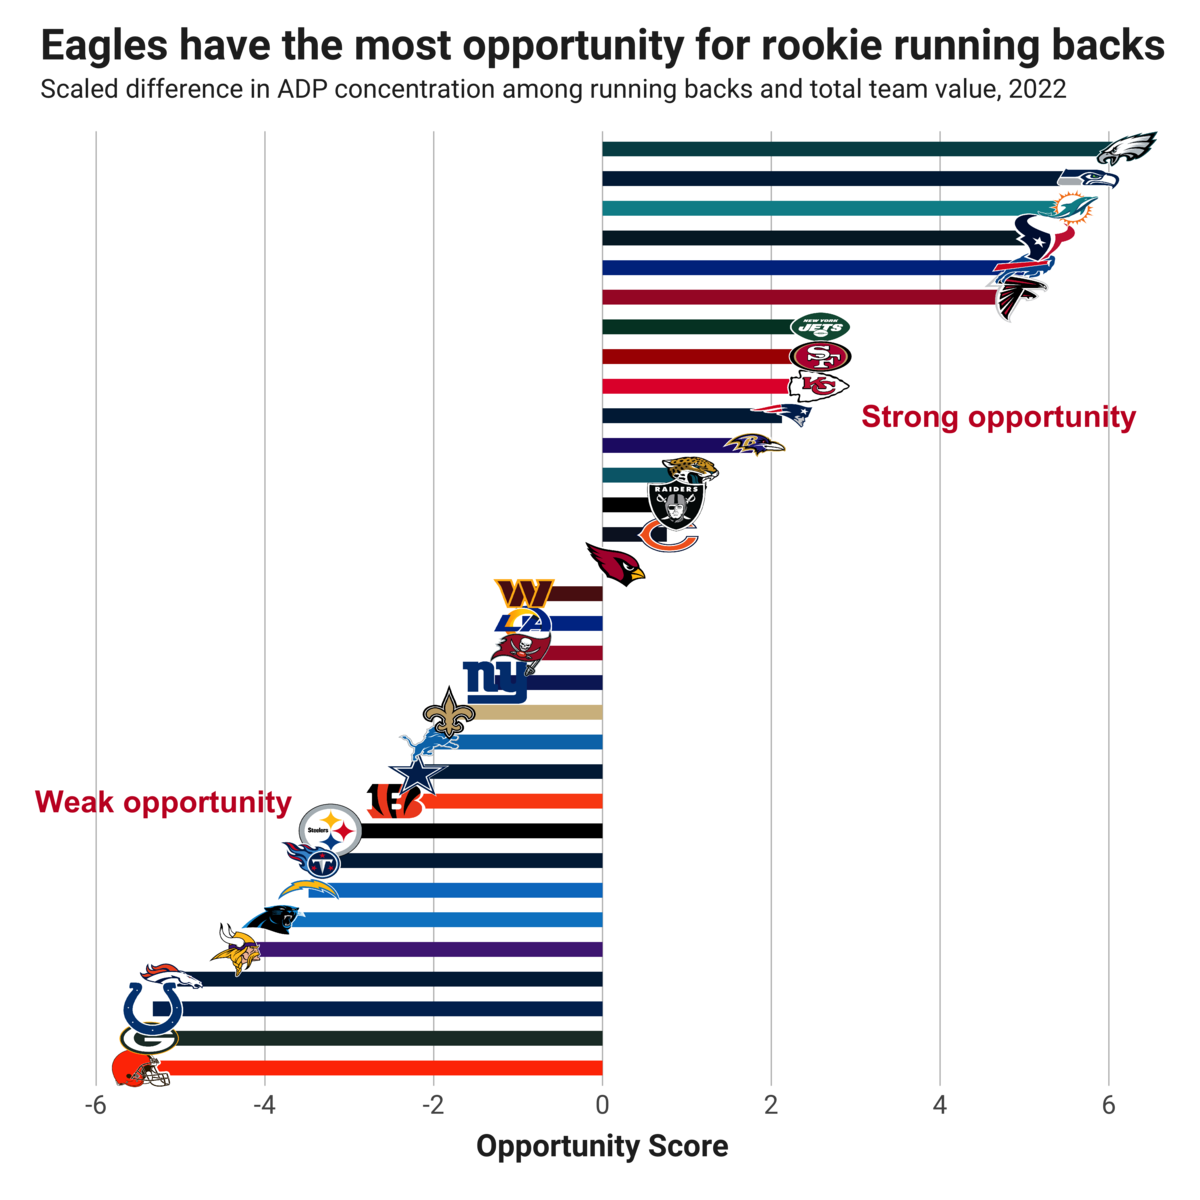
The Eagles lead a tight pack of teams with the most opportunity for rookie running backs, followed by the Seattle Seahawks, Dolphins, Houston Texans, Bills and Falcons. After that, there is a large drop to the Jets and others.
If any of these teams take a running back in the 2022 NFL Draft on Days 1 or 2, that player should get an immediate and significant boost in best-ball leagues and dynasty rookie drafts.