PFF's fantasy team has been working tirelessly to produce our fantasy rankings and fantasy projections, which leverage the modeling capabilities of Eric Eager and our research and development team. This series of articles will go through the top fantasy players by best ball ADP at Underdog Fantasy and compare their relative positional value against our half-PPR projections. This analysis focuses on the running back position.
It’s not intuitive, but projections and rankings aren’t interchangeable. Each provides valuable insight, but they are calculated through different methods. Our projections are based on a combination of model-based efficiency projections and analyst-informed share assumptions. Rankings and ADP are informed by projections, but they combine more opaque effects like upside, floor and contingency value that are more difficult to model into projections.
While acknowledging that projections aren’t a substitute for rankings, I’ve translated our projections into positional rankings for comparison with best-ball ADP ranks in this piece. Projections aren’t necessarily better when it comes to ranking players, but they aren’t as influenced by market sentiment and can be a more independent view of player value.
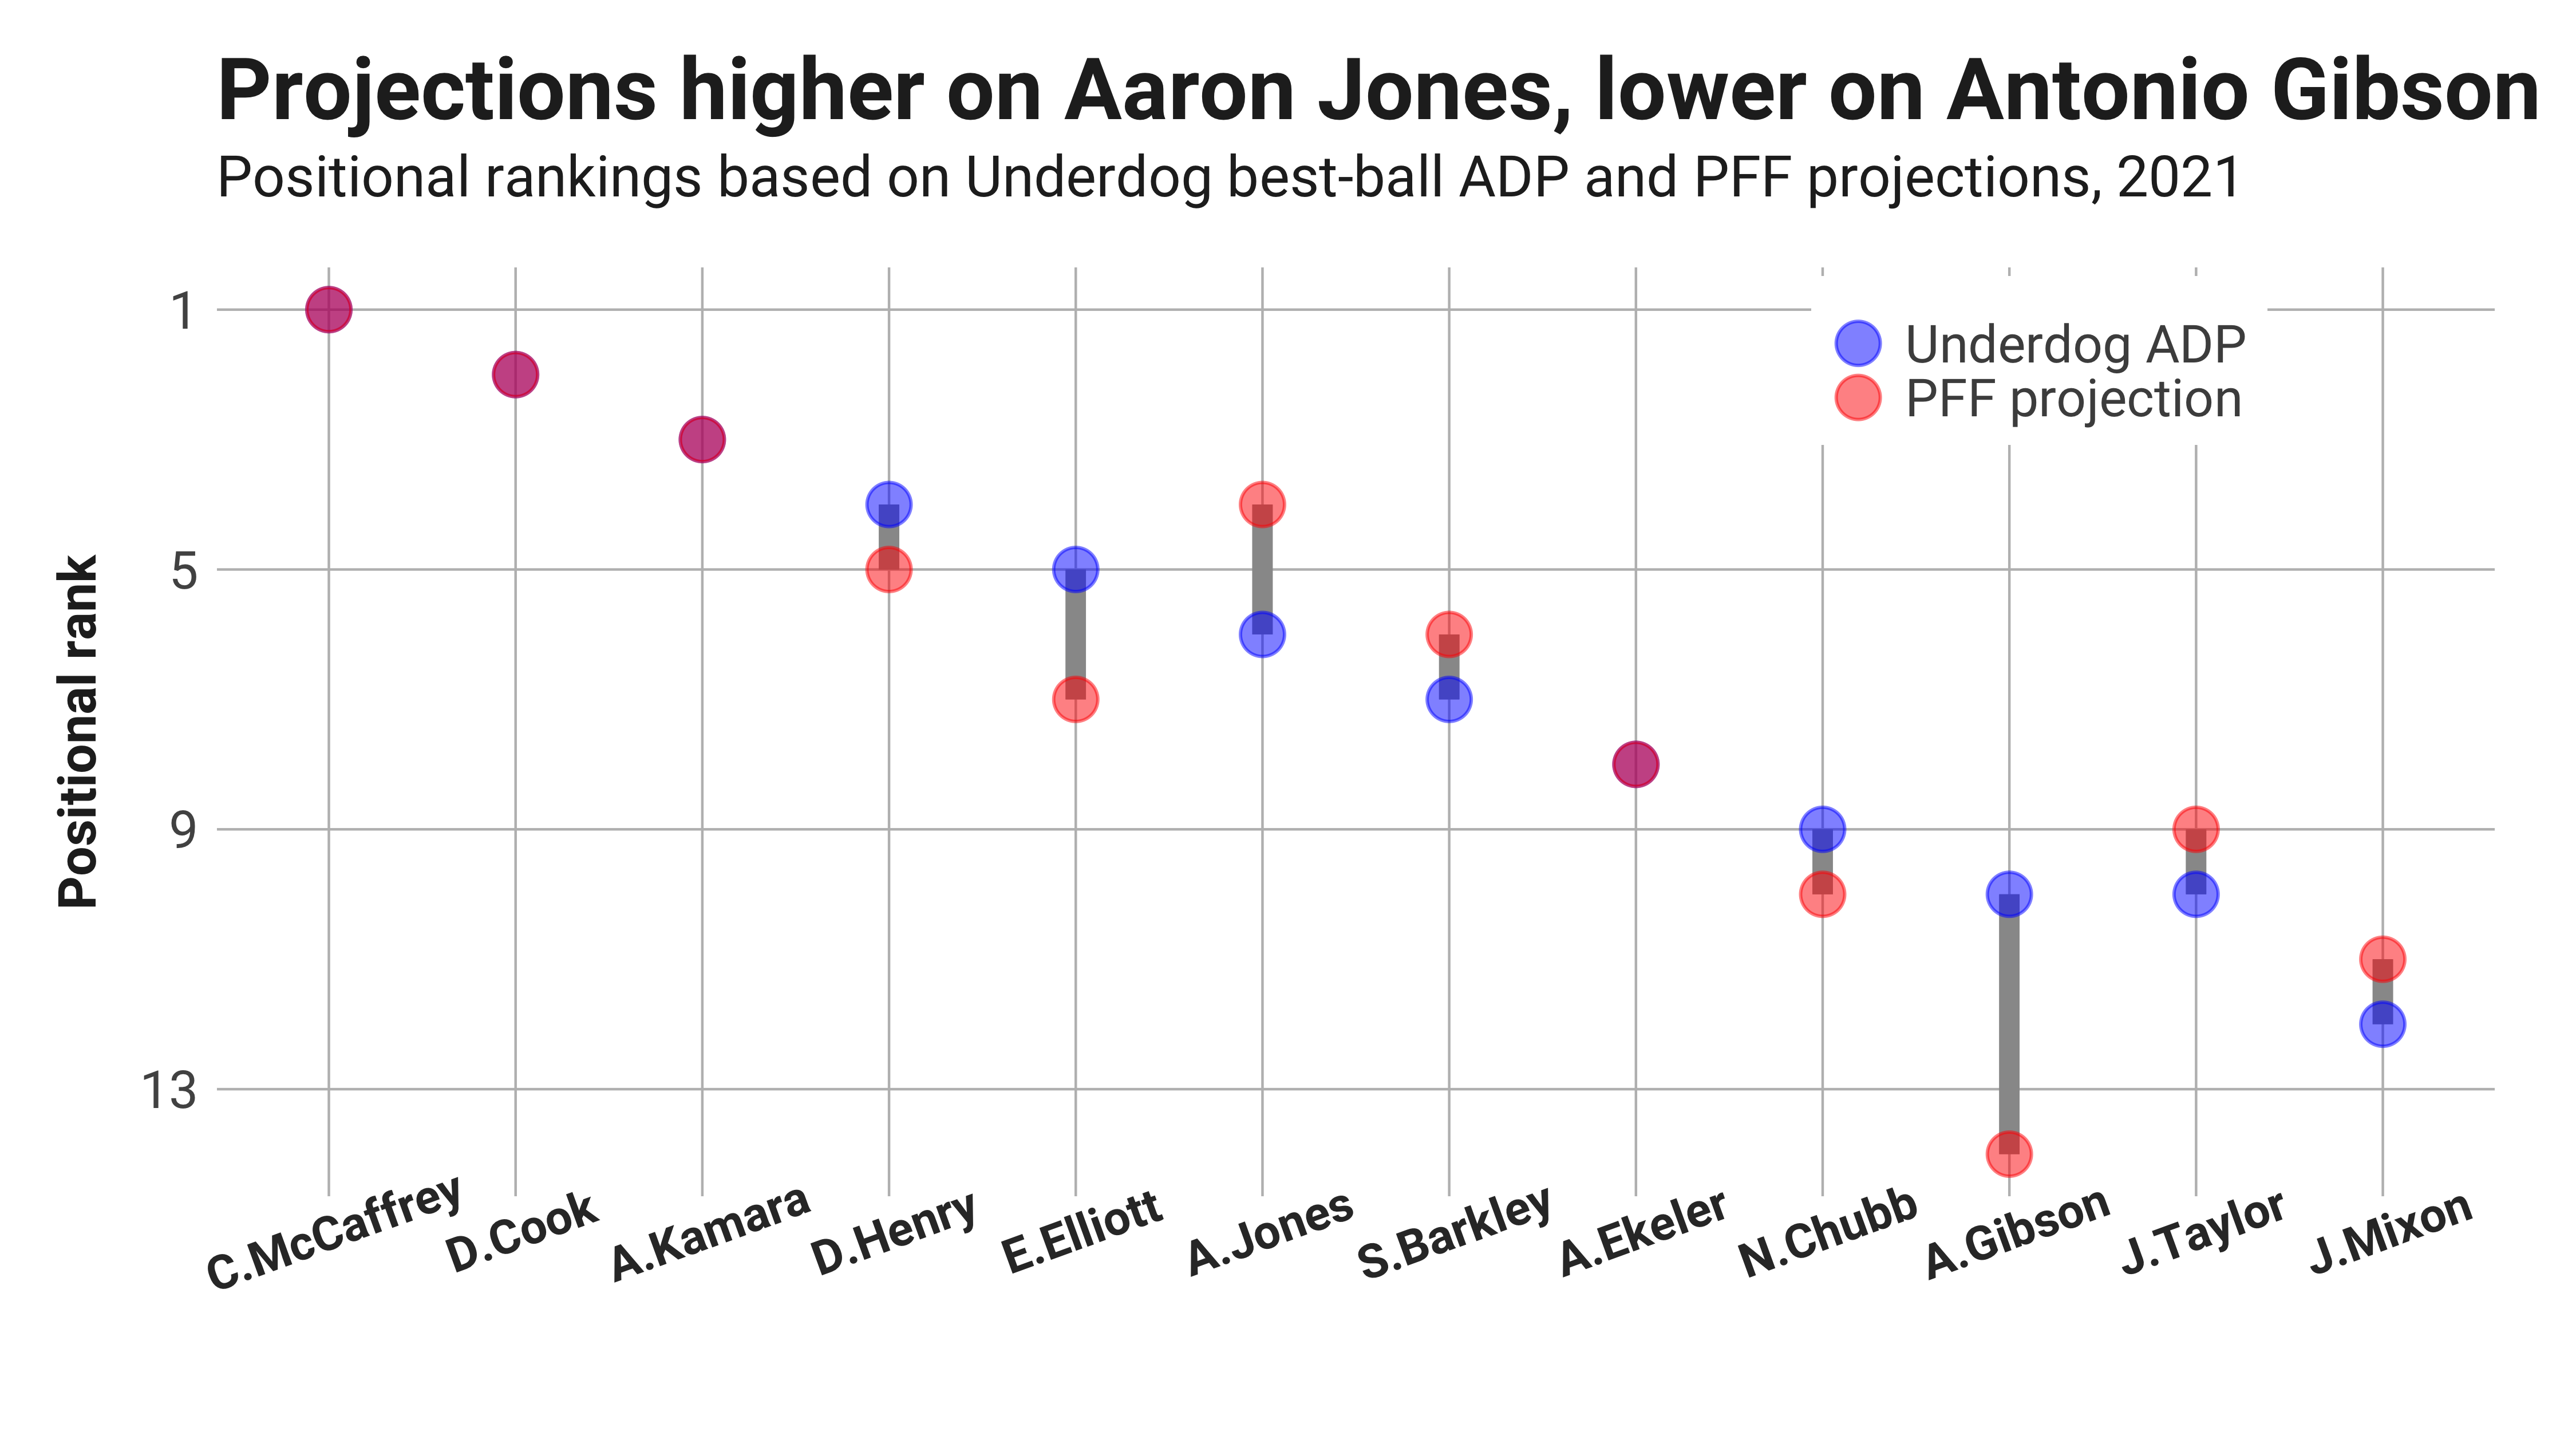
Below, I’ve visualized the top 48 fantasy running backs by current Underdog ADP, contrasting their ranks with PFF projections. Often, our projections agree about the valuation of players relative to ADP, identifying players who should be prioritized or faded in drafts. We also find some substantially misvalued players, and the visualization provides an easy way to judge the magnitude of the differences in rankings.
Click here for more PFF tools:
PFF Fantasy Draft Kit | PFF Betting Dashboard | PFF Fantasy Rankings
PFF Fantasy Projections | NFL Premium Stats | Win Totals Tracker
THE TOP-12 RUNNING BACKS
The running backs below are listed in order of positional ADP rank, with the blue points representing Underdog ADP and the red points marking the rank by PFF projections. When two or more measures fall on the same positional rank, the point's color will represent a mix. The lines between points illustrate the magnitude of the difference between the maximum and minimum ranking for each player.
Aaron Jones looks undervalued in best-ball drafts versus our projections despite a fairly conservative 50% rushing share assumption. We see Jones handling 12% of targets, and that reception boost moves the Packers back up in our rankings. We also see his touchdown upside continuing in one of the NFL’s best offenses.
On the flip side is Antonio Gibson, who is RB16 in our projections and lower than his RB10 ADP in Underdog best-ball drafts. J.D. McKissic continues to impede the second-year back from seizing a true workhorse role, as the veteran's 8.5% target share nearly equals our 9% assumption for Gibson. If their roles unexpectedly change this year and Gibson takes over on obvious passing downs, his upside is one of the highest out there.
SECOND-TIER RUNNING BACKS
Exclusive content for premium subscribers

WANT TO KEEP READING?
Dominate Fantasy Football & Betting with AI-Powered Data & Tools Trusted By All 32 Teams
Already have a subscription? Log in


 © 2025 PFF - all rights reserved.