(Metrics that Matter is a regular offseason feature that examines some aspect of fantasy through a microscope to dive into the finer details.)
In NFL gambling circles, you’re considered either incredibly lucky or tremendously bright if you manage to win on even 55 percent of your bets (just barely better than a coin flip) over a large enough sample. With millions of dollars at stake, Vegas is incentivized to make the sharpest lines possible, and for the most part, they’re extremely successful at doing so. For this reason, each offseason, I try to spend some time looking at Vegas lines and trying to determine what these lines might mean for fantasy.
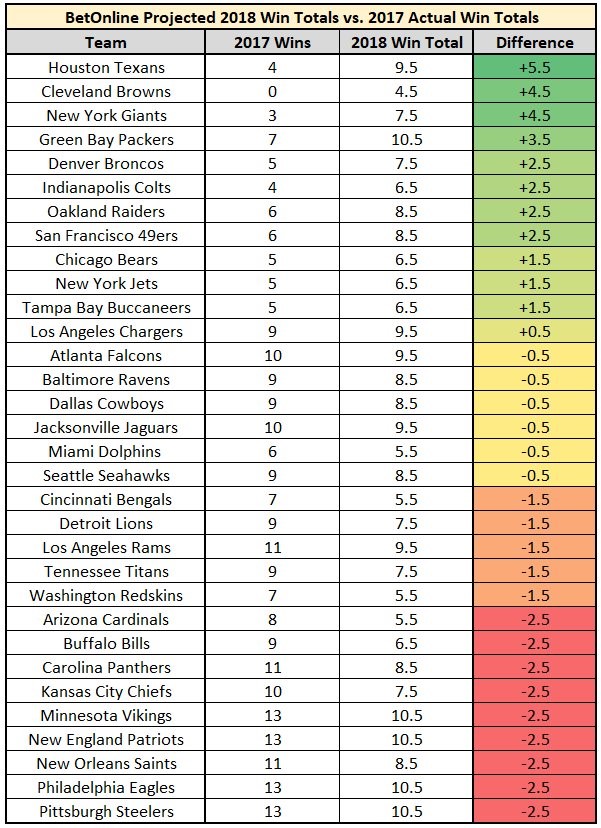
Today, we’re going to look at BetOnline’s 2018 projected win totals in contrast to that team’s 2017 win totals. We are then going to try to determine what this might mean for the top fantasy players on the teams projected to improve the most or least. Our most recent article looking at the most and least gamescript-dependent players in fantasy will help aid in our analysis.

Positional disparity/general
In our last article, we looked at the fantasy splits of various players by whether their team was trailing or leading. We noted that running backs tended to score a higher percentage of their fantasy points when leading, while the opposite was true for quarterbacks, wide receivers, and tight ends.
Over the past three seasons, winning teams average 18.4 fantasy points per game at the quarterback position. Losing teams average 14.2. However, over the same span, teams trailed on 46 percent of their offensive plays, but 50 percent of all quarterback scoring occurred while trailing. Teams led on 34 percent of their offensive plays, but only 31 percent of quarterback scoring occurred while leading. These splits were nearly identical for wide receivers and tight ends.
This may seem confusing, but really, this has to do with a few different factors:
- Passing efficiency has a much higher correlation to wins than rushing efficiency. If a team was victorious, it’s highly likely its quarterback was more efficient than the opposing quarterback. This is why victorious quarterbacks average more fantasy points than losing quarterbacks. The best quarterbacks in the league also tend to win more games than their peers.
- Teams play at a quicker pace when trailing (more plays overall while trailing) and are also more pass-heavy when trailing. Over the past three seasons, teams passed on 50 percent of their plays when leading, 56 percent with the score tied, and 66 percent when trailing.
So, while winning teams score more fantasy points at the quarterback position on average, it can also be true that most quarterbacks are more productive when trailing. Wide receivers and tight ends also average more fantasy points when victorious and are more productive when trailing. This is not true for most running backs, however.
Over the past three seasons, winning teams average 26.2 fantasy points per game at the running back position. Losing teams average 20.6. Over the same span, teams trailed on 46 percent of their offensive plays, but only 44 percent of all running back scoring occurred while trailing. Teams led on 34 percent of their offensive plays, but 36 percent of running back scoring occurred while leading.
However, as evident by our most recent article, this wasn’t true for all running backs. Early-down workhorses benefit more from a lead, while pass-catching specialists perform better when trailing. This is because 52 percent of all running back targets came while trailing, while only 29 percent of all running back targets occurred when leading.
I should also note that it might not be the case that Vegas really suspects the rosters of Minnesota, New England, Philadelphia, and Pittsburgh have deteriorated to the point that they should win 2.5 fewer games next year. Rather, it’s just really hard for a team to win 13 games. I suspect this has more to do with projections typically erring on the side of caution and the fact that one major injury could completely derail a team’s season.
With these factors in mind, here are my top fantasy takeaways for the teams projected to climb or depreciate the most in wins next season:
Houston Texans (+5.5)
It’s no surprise Houston tops the list of teams most likely to improve on their 2017 win total. Last season, three of Houston’s four wins came with Deshaun Watson (103.0 passer rating) under center. The offense and entire team should be much better off in his return than it was when Tom Savage (71.4) or T.J. Yates (65.8) were starting. Running back Lamar Miller averaged 3.5 more fantasy points per game when Watson saw the field. Ridiculously, DeAndre Hopkins ranked first (21.1) and Will Fuller ranked second (21.0) among all wide receivers in fantasy points per game prior to Watson’s injury. Houston’s defense should also get a significant boost from a healthy J.J. Watt, who has missed 24 games over the past two seasons.
Cleveland Browns (+4.5)
Vegas projects Cleveland to improve significantly on its zero-win season last year, though the team is still projected to finish last within its division. The improvement in wins should help whoever the early-down running back might be (Carlos Hyde, Nick Chubb, or some combination thereof), but it may actually have a negative impact on Duke Johnson, who scored 83 percent of his fantasy points when trailing (though the team only trailed 76 percent of the time). That said, both Tyrod Taylor and Baker Mayfield have targeted running backs at a rate well above average throughout their respective careers.
New York Giants (+4.5), Green Bay Packers (+3.5), Denver Broncos (+2.5), Indianapolis Colts (+2.5)
Denver ranks second-worst in team passer rating over the past three seasons, and in spite of this, Demaryius Thomas ranks ninth and Emmanuel Sanders ranks 18th among wide receivers in fantasy points over this stretch. Hopefully, as Vegas seems to imply, improved quarterback play thanks to the free agency signing of Case Keenum (who ranked seventh in passer rating last year) leads to more wins for Denver and more fantasy points for Thomas and Sanders. Green Bay (Aaron Rodgers returning from injury), New York (Odell Beckham Jr.), and Indianapolis (Andrew Luck) all feel like safe bets to improve in wins, so long as their star players all return to the field. Beckham’s return might mean fewer targets for Sterling Shepard and Evan Engram, but Eli Manning and all New York receivers should improve in efficiency thanks to the star’s return. Rodgers’ return should pay dividends for all of Green Bay’s offensive players, and even Davante Adams, who finished eighth in fantasy points per game among wide receivers last year, might take another step forward. Luck’s health is incredibly important to the fantasy success of T.Y. Hilton, who throughout his career averages 15.1 fantasy points per game with Luck in the lineup and only 11.3 without.
Kansas City Chiefs (-2.5)
Vegas seems a tad bearish on Kansas City after jettisoning Alex Smith to Washington in favor of the inexperienced Patrick Mahomes. 2.5 fewer wins seems like it might negatively impact Kareem Hunt, but I’m not sure that’s going to be the case. Kansas City was already the league’s second-most pass-heavy team when trailing last year, and offseason comments have continually [1, 2] implied Hunt will see a larger workload as a receiver this year. For other reasons I explained here why I think it’s unlikely all of Tyreek Hill, Sammy Watkins, and Travis Kelce hit ADP, though the target boost when trailing might help.
Buffalo Bills (-2.5)
Vegas is projecting 2.5 fewer wins for Buffalo next season, and I’m in complete agreement after the losses of multiple starting offensive linemen and quarterback Tyrod Taylor. Due to an increase in targets while trailing, LeSean McCoy benefited slightly more from negative than positive game script last season. He might not be hurt too much by the 2.5-fewer wins Vegas is projecting, but he will be negatively impacted by the losses to the offensive line. Similarly, more negative gamescript might mean more targets for Buffalo’s receiving corps, but the loss of Tyrod Taylor in favor of some lesser-experienced quarterbacks doesn’t inspire much confidence at all.
Carolina Panthers (-2.5)
With Vegas projecting 2.5 fewer wins for Carolina, I can’t help but wonder if this doesn’t boost Christian McCaffrey’s value in fantasy. 41 percent of McCaffrey’s touches came via the air last season, which ranked second-most of all 100-touch running backs. Last season 47 percent of his fantasy points came with the team trailing, though the team only trailed 37 percent of the time.
Arizona Cardinals (-2.5)
Despite ranking third-worst in team passer rating (76.1), Arizona somehow managed to finished 8-8. Although they appear better off at the quarterback position this year, after adding Sam Bradford in free agency and Josh Rosen in the first round of the draft, I agree with Vegas’ assessment of the team. The decrease in wins could mean more targets for the receiving corps, but also for running back David Johnson who led the position in targets in 2016. He’s one of only a few gamescript-proof bell cows left in the NFL.
Washington Redskins (-1.5)
Washington dealt with a multitude of injuries to its offensive line and receiving corps last season, but even with what will likely be improved injury luck this year, Vegas seems to imply the team is worse off today than they were a year ago (when Vegas projected 7.5 wins for Washington). This is likely not unrelated to Kirk Cousins leaving in free agency and the team’s decision to replace him with Alex Smith via trade. If Vegas is right, this could mean better gamescript for Chris Thompson, who (before suffering a broken leg in Week 11) ranked 11th at the position in fantasy points per game, despite ranking 49th in carries per game and 10th in targets per game. Considering how efficient he was, he’s likely due for a natural regression, but perhaps this is offset by the increase in volume due to an increase in negative gamescript.


 © 2025 PFF - all rights reserved.