In our last article, I highlighted quarterbacks atypically sensitive to a particular coverage scheme (man or zone). One takeaway from the article was how much better New Orleans Saints QB Drew Brees performed against man coverage rather than zone coverage over the past two seasons. After discussing the significance with Saints beat writer Nick Underhill, I’m not sure the data is very meaningful, and isn’t just skewed by variance on a small sample.
He posited that the data may have been disrupted by a two-week stretch where Brees was potentially dealing with an injury. In Weeks 13 and 14, Brees faced off against the zone-heavy Lions (68.4 percent) and Buccaneers (73.3 percent). In these two games, he totaled 583 yards on 85 attempts (6.86 yards per attempt), with no touchdowns and six interceptions. In his previous 125 games, he only had two total games without a touchdown pass. Since 2009 (134 games), Brees has only ever posted a passer rating below 65.0 six times. Two of those games came during this two-week stretch. To round out the season, over his next three games, Brees returned to form, totaling 1,038 yards on 132 attempts (7.86 yards per attempt), with seven touchdown passes and only one interception.
As a means of making amends to Mr. Brees, assuming he was injured during this stretch, I wanted to be more complimentary of him in today’s piece.
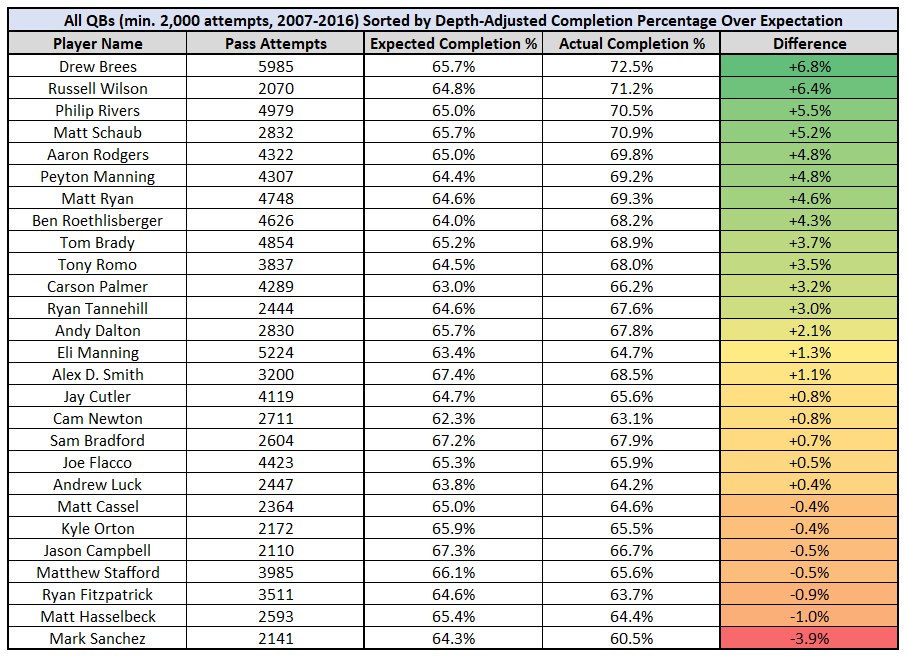
In 2013, Mike Clay introduced the idea of depth-adjusted completion percentage. In this exercise, mirroring his process, I’m looking at every pass attempt since 2007, then I’m stripping out all spikes, throwaways, batted passes, and instances where a quarterback was hit as he threw (to the point where it disrupted their throwing motion) from our sample. After removing these data points, I’m looking at the average completion percentage of each throw by depth of target. (Intuitively, the farther the ball travels through the air, the more difficult it is to complete a pass.) Then, based on the average completion percentage of each attempt by depth on target, we can calculate a quarterback’s expected completion percentage. Contrasting this with a quarterback’s actual completion percentage tells us how accurate a quarterback was over his expectation.
Drew Brees is the all-time leader in completion percentage, but that doesn’t tell us anything terribly significant as far as efficiency goes. Sam Bradford led the league in completion percentage last season (71.6 percent), but he also was attempting mostly high-percentage throws. Last season, he had the lowest average depth of target in the league (6.6). For reference, Cam Newton led the league in average depth of target at 11.0 yards.
Among all quarterbacks with at least 2,000 qualifying pass attempts since 2007, Brees also leads in depth-adjusted completion percentage over expectation, suggesting he’s been the most-accurate passer of the past decade.

What does this mean for fantasy?
A problem with looking at a receiver’s efficiency numbers is that it’s hard to differentiate how much responsibility we should put on the receiver as opposed to the quarterback. There’s an old saying, “a rising tide lifts all boats.” For fantasy football, we can say, “a Brees lifts all boats.”
Last season, New Orleans had three wide receivers ranking in the top 10 in depth-adjusted yards per target over expectation. Over the past 10 seasons, wide receivers when targeted by Brees average 2.02 fantasy points per target. This 2.02-point average (for wide receivers) ranks second-best this past decade among all quarterbacks, behind only Aaron Rodgers. League average for wide receivers is 1.71 fantasy points per target.
Last season, only 23 of 63 qualifying wide receivers posted a yards-per-target average over 9.0. Over the past decade, among all (eight) wide receivers to see at least 75 targets from Brees, only Lance Moore (8.6) compiled a yards-per-target average below 9.0.
Looking at Michael Thomas‘ 77.3 percent catch rate last season (fifth-best), we'd typically assume these numbers should regress closer to league average next season, and adjust our projections accordingly. However, given Brees’ historic efficiency statistics, I’m not sure these numbers are terribly out of line with what should be our expectation.
Last season, Ted Ginn caught only 61 percent of his passes (43rd of 63), on the back of a woefully inefficient season for Newton. Over the final eight weeks of the season, Newton's passer rating of 68.5 ranked 31st, ahead of only Jared Goff. Ginn’s current ADP of WR53 makes little sense considering he finished 46th at the position last year despite far worse quarterback play.
Brees has finished as a top-six fantasy quarterback in each of the past 11 seasons, with seven finishes in the top-three. He’s about as safe of a pick as it gets, even despite the offseason loss of Brandin Cooks.


 © 2025 PFF - all rights reserved.