Our series of analyses on the single-game DraftKings showdown slates uses the combination of current projections, historical game results and similarity algorithms to simulate an upcoming game by looking back at the most similar historical matchups.
Click here for more PFF tools:
Rankings & Projections | WR/CB Matchup Chart | NFL & NCAA Betting Dashboards | NFL Player Props tool | NFL & NCAA Power Rankings
In this analysis, I’m taking the same outline and applying it instead to the DFS main slate by projecting the likelihood each individual quarterback, running back, wide receiver, tight end and D/ST option will be the highest scorer of the slate. In doing this, we can find the unlikely tournament plays who may not have been on your radar.
METHODOLOGY
For each game on the DFS Sunday main slate, I looked through thousands of NFL matchups from 2014-2021 and found the closest analogies according to the following parameters: betting spread, over/under and average fantasy points scoring for the top-ranked positional players of both rosters (QB1, RB1, WR1, TE1).
Once I get the 75 most similar matchups for each upcoming game, I then simulate the main slate 10,000 times by randomly choosing one of the 75 matchups for each game. Then, I find the highest-scoring quarterback, running back, wide receiver, tight end and D/ST on the slate.
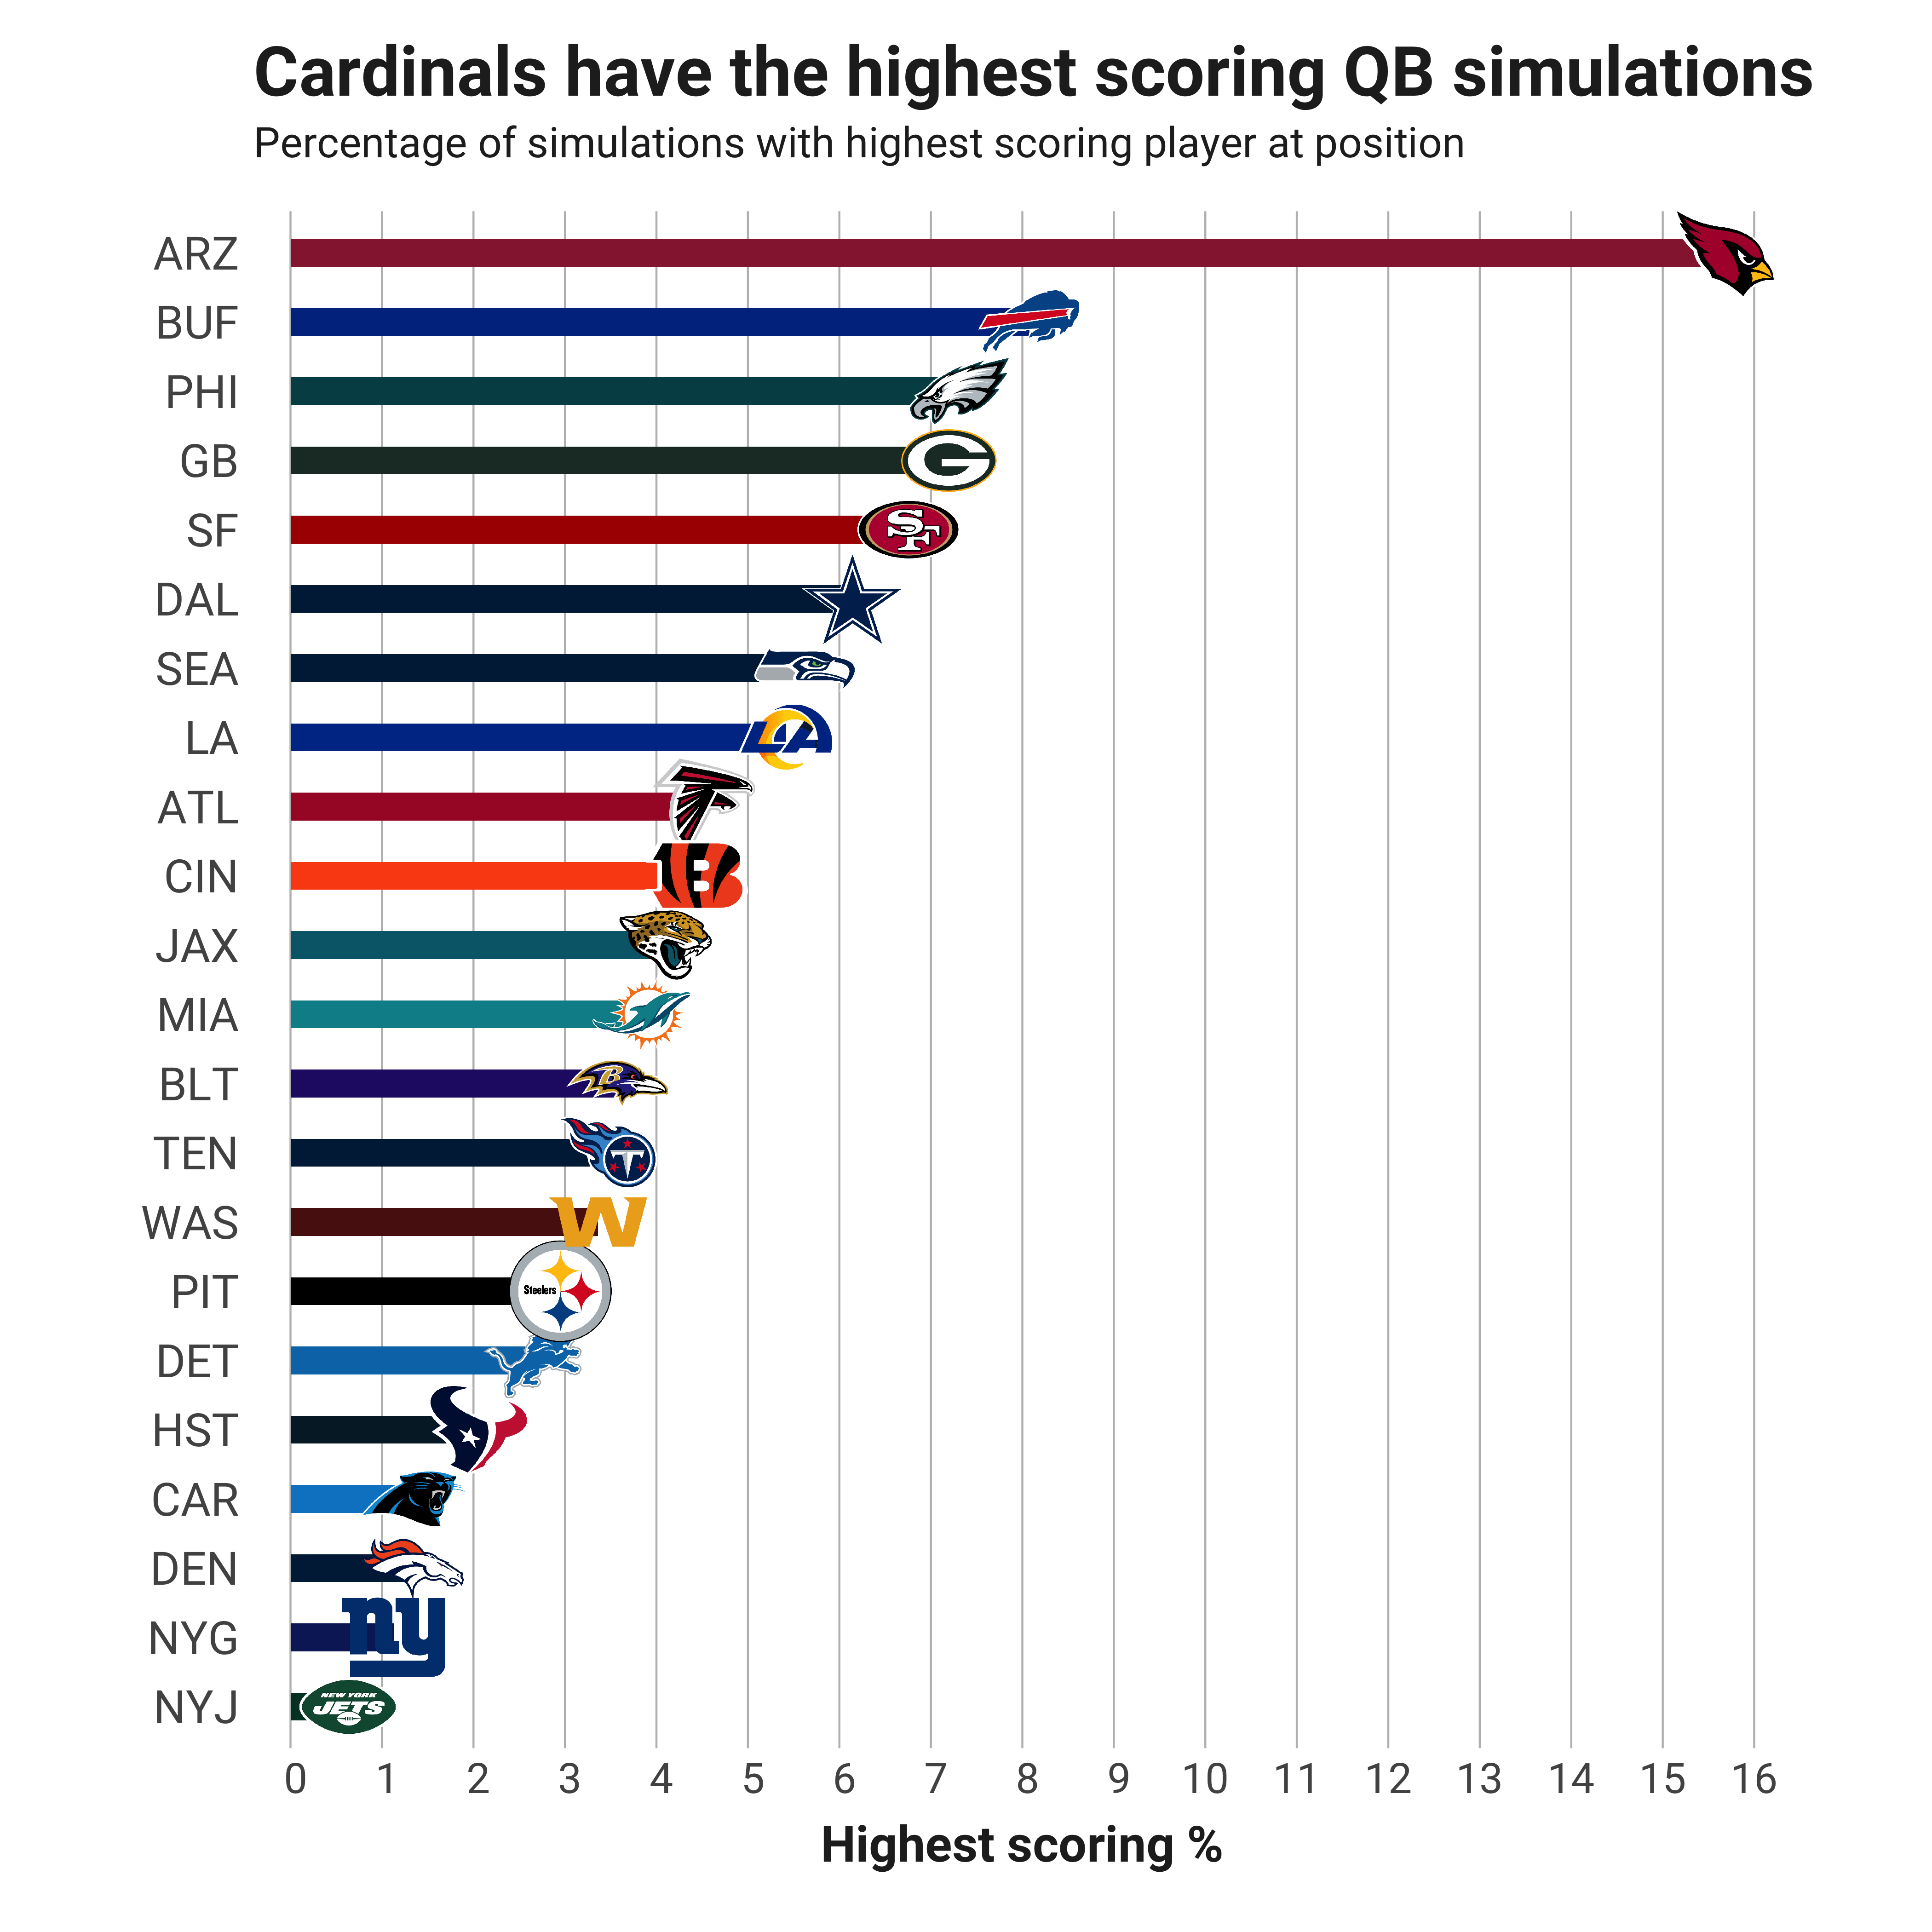
The last step is totaling the number of times a particular team shows up as the top option for the slate at each position and dividing by the total simulations. That number is what I call “highest-scoring %” in the team-labeled bar charts below. Below the charts, I join the highest-projected player on that team for the position, then list their projected fantasy points and salaries for DraftKings and FanDuel.
QUARTERBACKS

| Pos | Highest % | Player | Team | DK Fpts | DK Salary | FD Fpts | FD Salary |
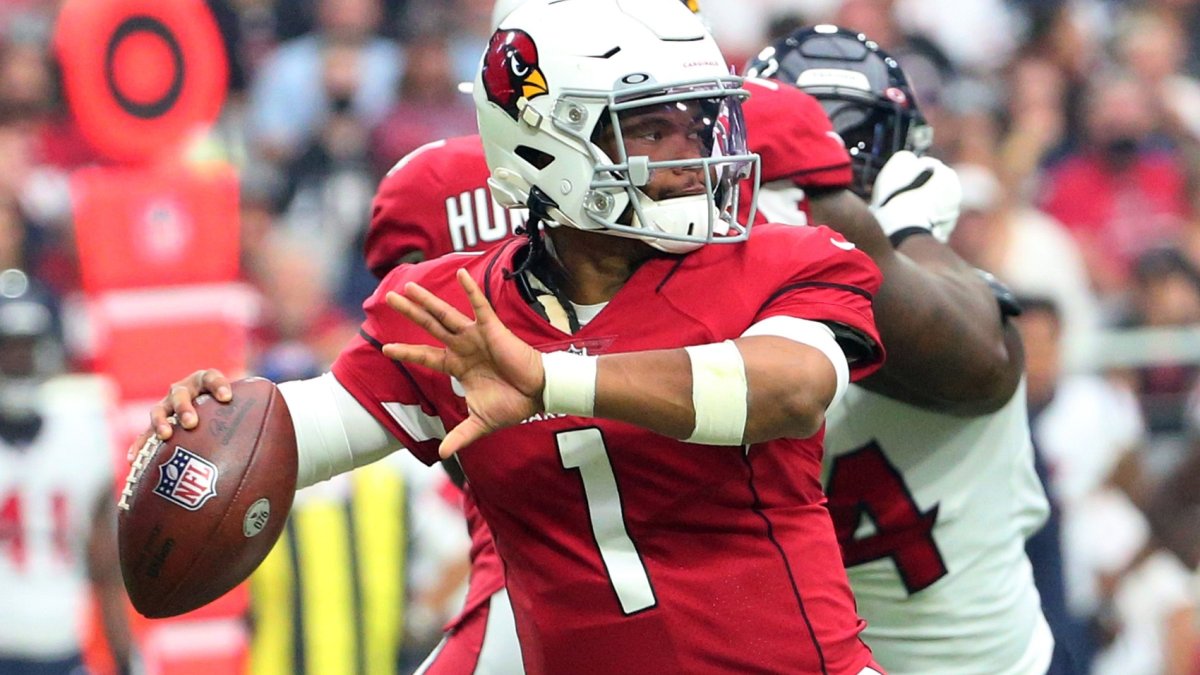
| QB | 15.67 | Kyler Murray | ARZ | 26.8 | 7,900 | 25.4 | 8,800 |
| QB | 8.08 | Josh Allen | BUF | 24.6 | 8,100 | 23.1 | 8,700 |
| QB | 7.32 | Jalen Hurts | PHI | 23.0 | 6,600 | 21.7 | 7,800 |
| QB | 7.20 | Aaron Rodgers | GB | 20.8 | 7,500 | 19.6 | 7,600 |
| QB | 6.76 | Jimmy Garoppolo | SF | 20.4 | 5,800 | 19.0 | 6,700 |
| QB | 6.15 | Dak Prescott | DAL | 20.5 | 6,500 | 19.2 | 7,500 |
| QB | 5.63 | Russell Wilson | SEA | 21.1 | 6,400 | 19.7 | 7,200 |
| QB | 5.42 | Matthew Stafford | LA | 23.7 | 7,000 | 21.8 | 7,700 |
| QB | 4.52 | Matt Ryan | ATL | 18.7 | 5,300 | 17.4 | 6,500 |
| QB | 4.44 | Joe Burrow | CIN | 21.8 | 6,100 | 20.1 | 7,300 |
| QB | 4.10 | Trevor Lawrence | JAX | 19.1 | 5,100 | 17.8 | 6,500 |
| QB | 3.84 | Tua Tagovailoa | MIA | 21.5 | 5,700 | 20.2 | 7,400 |
| QB | 3.58 | Lamar Jackson | BLT | 23.2 | 7,200 | 21.7 | 7,700 |
| QB | 3.45 | Ryan Tannehill | TEN | 19.1 | 5,900 | 18.2 | 7,000 |
| QB | 3.36 | Taylor Heinicke | WAS | 17.0 | 5,500 | 15.9 | 6,900 |
| QB | 2.95 | Ben Roethlisberger | PIT | 15.6 | 5,600 | 14.6 | 6,600 |
| QB | 2.65 | Jared Goff | DET | 10.4 | 5,100 | 9.9 | 6,400 |
| QB | 2.05 | Davis Mills | HST | 17.8 | 5,400 | 16.5 | 6,800 |
| QB | 1.35 | Cam Newton | CAR | 16.7 | 5,400 | 15.8 | 6,900 |
| QB | 1.34 | Teddy Bridgewater | DEN | 18.7 | 5,500 | 17.5 | 6,600 |
| QB | 1.13 | Mike Glennon | NYG | 14.4 | 5,200 | 13.5 | 6,700 |
| QB | 0.64 | Zach Wilson | NYJ | 14.3 | 5,200 | 13.4 | 6,500 |

Exclusive content for premium subscribers

WANT TO KEEP READING?
Dominate Fantasy Football & Betting with AI-Powered Data & Tools Trusted By All 32 Teams
Already have a subscription? Log in


 © 2025 PFF - all rights reserved.