• Unlock your edge with a PFF+ subscription: Get full access to all our in-season fantasy tools, including weekly rankings, WR/CB matchup charts, weekly projections, the Start-Sit Optimizer and more. Sign up now!
Estimated reading time: 6 minutes
Welcome to the latest installment of “Coach, I Was Open,” my ongoing statistics series, where I build and refine a model to predict targets for every route in every NFL game.
I created this model using route-level PFF data to predict the probability of each route being targeted on every play in the NFL. From this model, we can generate interesting metrics such as “share of predicted targets” and “share of predicted air yards.” These metrics are more stable and predictive than their actual counterparts.
The core idea behind creating this model is that a player might be “earning targets” by consistently getting open and running valuable routes but not receiving targets for various reasons—such as quarterback pressure, a misread, or the quarterback forcing the ball elsewhere. After reviewing the film, teams may recognize that certain players were open and adjust their game plan to involve them more in subsequent weeks.
Later in this article, we’ll examine how quarterbacks have made optimal or suboptimal decisions compared to the “predicted targets” model!
Week 11 Recap
Garrett Wilson was a disappointment in fantasy, but he still led the team with eight targets.
Cooper Kupp had a fantastic fantasy performance, leading the Rams with 10 targets.
DeVonta Smith saw six targets but failed to exceed expectations.
Ladd McConkey and Xavier Worthy both delivered some of their best performances of the season, each leading or tying for the lead in targets for their respective teams.
Lastly, Austin Ekeler led his team in targets and turned in a great performance.
IDENTIFYING BREAKOUT CANDIDATES FOR WEEK 12

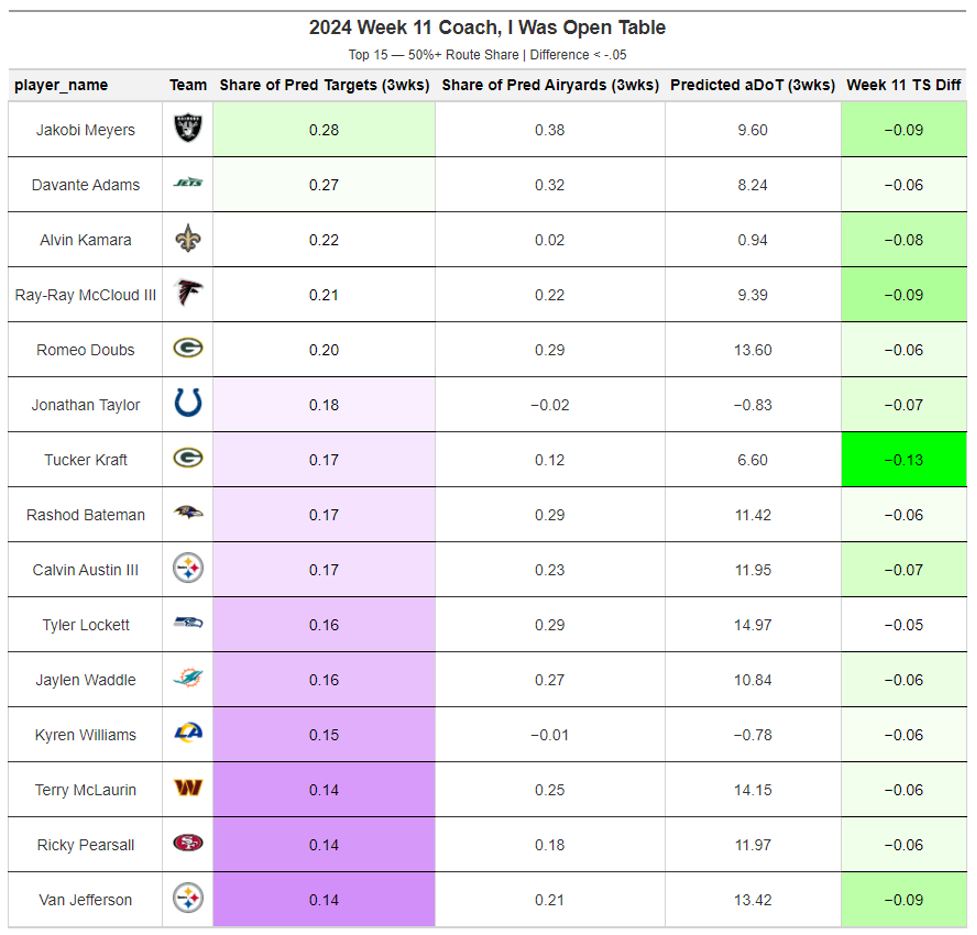
Jakobi Meyers is this week’s headliner (via three-week PWOPR). The Raiders face a tough Broncos defense, which has deployed the seventh-most MOFC coverage (middle of the field closed) over the last month, presenting a favorable matchup for wide receivers.
Meyers and Brock Bowers are tied for the most targets against MOFC coverage this season, even though Meyers has missed a few games. However, not all signs point to a big performance, as Gardner Minshew ranks 28th out of 33 quarterbacks in PFF passing grade versus MOFC coverage.
Romeo Doubs makes an appearance on both the “Coach, I Was Open” table and the Route-Based Heroes model for Week 12. Doubs also benefits from a strong single-coverage matchup this week against the 49ers.
Calvin Austin III also appears on both the “Coach, I Was Open” table and the Route-Based Heroes model for Week 12. The Steelers face the Browns on Thursday Night Football, and Cleveland has the third-worst PFF team coverage grade over the last month while running the fifth-most MOFC coverage during that span. These factors suggest Austin is poised for a big game.
Quarterback Optimal Decisions via the Predicted Targets Model
The Predicted Targets Model allows us to evaluate a quarterback’s performance over a single game, a series of games, or even an entire season. This model analyzes every route on every play, calculating the probability that a given player will be targeted based on factors such as openness, PFF grade, level of separation, and more. By leveraging this route-level data, we can determine whether the quarterback made an optimal decision.
To simplify the analysis, I categorized every decision into three distinct categories:
1. Optimal Decision: The quarterback threw to the player with the highest target probability.
2. Suboptimal Decision: The quarterback threw to a player who did not have the highest target probability.
3. Bad Decision: The quarterback threw to the player with the lowest target probability.
It’s important to note that these categorizations are based on the model’s quantifications and may not always align perfectly with real-world outcomes. For example, Sam Darnold might throw a 25-yard jump ball to Justin Jefferson. While the model might label this as a suboptimal decision based on Jefferson’s openness, the context—such as Jefferson’s talent—might make it a good choice.
Example Play
Let’s break down a hypothetical play where four players ran routes with the following target probabilities:
- Justin Jefferson: 74.5% — Optimal Decision
- Jalen Nailor: 17.2% — Suboptimal Decision
- Aaron Jones: 13.7% — Suboptimal Decision
- Josh Oliver: 12.8% — Bad Decision
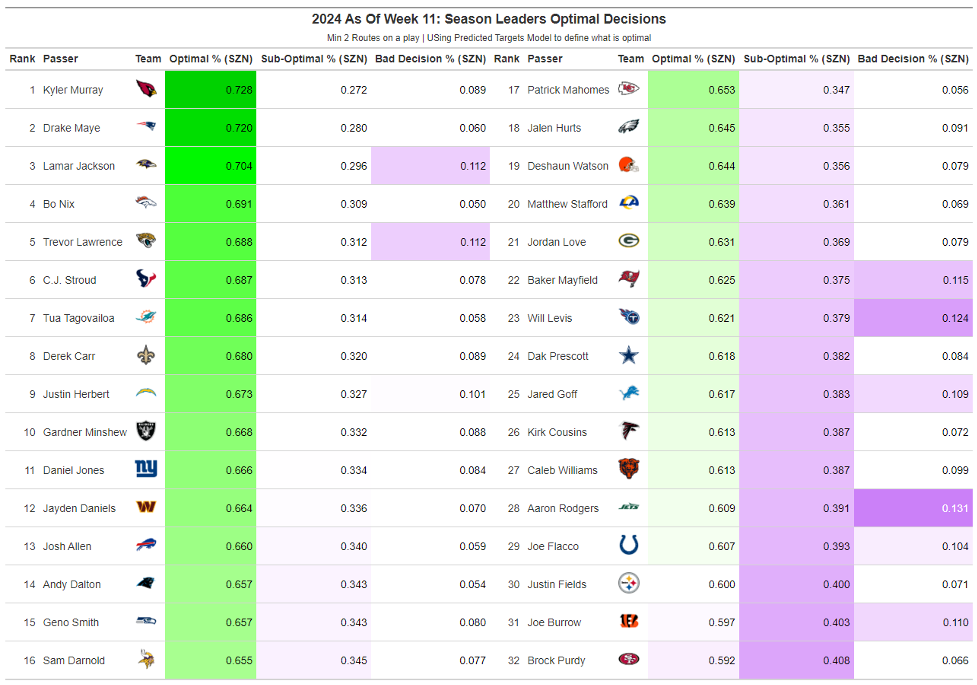
If Sam Darnold throws to each of these players, the corresponding decision category is shown above. I applied this process to every route on every play, aggregating the data into the table below for broader insights.
QUARTERBACK DECISIONS THROUGH WEEK 11

Kyler Murray has been the most efficient decision-maker in the NFL, making the optimal decision on 72.8% of his attempts—leading the league!
Among rookies, Drake Maye takes the top spot, though Bo Nix is not far behind.
It was surprising to see Daniel Jones and Gardner Minshew rank 10th and 11th, respectively. However, it’s important to remember that throwing to someone like Malik Nabers—when he’s the only player creating separation—still qualifies as an optimal decision, even if it seems straightforward.
Equally surprising was how low Brock Purdy and Joe Burrow ranked. This might reflect the quality of their systems and supporting casts, where multiple good decisions often exist on a given play. That said, both the 49ers and Bengals are underperforming compared to preseason expectations, and decision-making could be a contributing factor.
Aaron Rodgers leads the NFL in “Bad Decision Percentage,” throwing to the player with the lowest target probability on 13.1% of attempts.
This is the first time metrics like these have been created with such detailed data, so it’s worth noting that conclusions may evolve as we refine the approach. For example, Purdy ranking last in optimal decisions isn’t inherently bad; making the best decision becomes more challenging when multiple players are consistently open.
In future articles, I’ll explore how these numbers shift in various situations, such as first reads or third-and-long scenarios. For now, this metric offers a reasonable snapshot of how well a quarterback executes their specific offense, though it doesn’t fully account for the complexity or quality of that offense.
For more NFL stats and analysis, follow Joseph on Twitter/X.


 © 2024 PFF - all rights reserved.