In this series of articles, I’m looking at the breakout potential for running backs available in the middle rounds of fantasy drafts. This builds on my recent breakout receiver articles that profiled each of the second-year wide receivers. My research on 10 years of historical data points to second- and third-year backs as the most likely to break out from middling draft positions and also the most likely to generate the most excess value. You can find the rest of the articles on breakout running backs here.
[Editor’s note: Subscribe to PFF ELITE today to gain access to PFF’s Premium Stats and new Player Grades experience in addition to the 2020 NFL Draft Guide, 2020 Fantasy Rookie Scouting Report, PFF Greenline, all of PFF’s premium article content and more.]
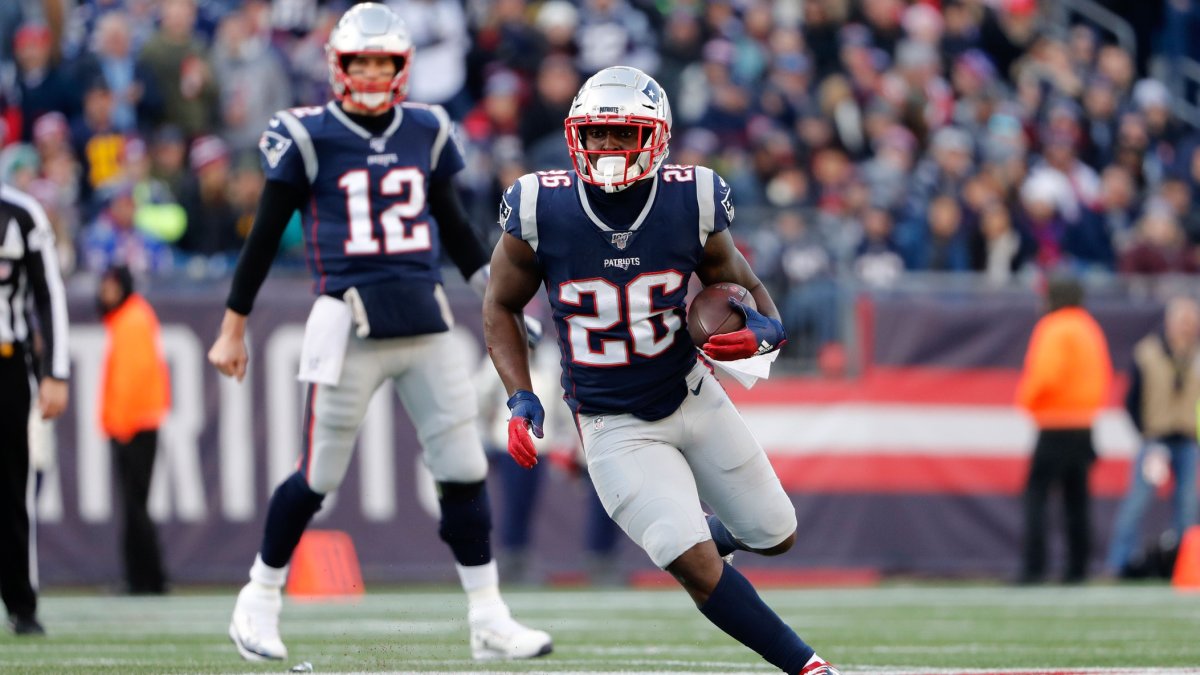
This article will focus on Sony Michel, currently the RB38 in best-ball drafts. When the New England Patriots selected Michel in the first round of the 2018 NFL Draft, the consensus view of him was that of a foundational, complete back who could function as a runner and receiver — an upgrade on the departing Dion Lewis. In reality, Michel has functioned largely as an early-down runner, similar to the way the Patriots used LeGarrette Blount in earlier years.
One of the best ways to determine the range of outcomes and the probability of success for fantasy players is comparing them to similar historical players. In this analysis, I’ll compare Michel to hundreds of running backs drafted since 2006 and project the likelihood of his breakout based on those who had the most similar size, draft position and rookie metrics.
I’ll be especially focused on the receiving potential for these backs, as the outperformance in receiving volume and efficiency has been the most common trait for breakout running backs in the past.
METHODOLOGY
The matching methodology for this set of articles is similar to that for the 2020 wide receiver and running back prospects, where I found the closest statistically comparable players using principal component analysis (PCA) and the euclidean distance between the players' components. Then, I gave each a “similarity” score based on percentile of distance.
The metrics for PCA are draft position and second-year numbers for rush attempts per game, targets per game and PPR fantasy points per game, plus rookie PPR fantasy points per game. I also use weight and 40-yard dash times as filters, including only historical players within +/- 15 pounds and +/- 0.15 seconds in the matching process.
SONY MICHEL COMPS
Exclusive content for premium subscribers

WANT TO KEEP READING?
Dominate Fantasy Football & Betting with AI-Powered Data & Tools Trusted By All 32 Teams
Already have a subscription? Log in


 © 2025 PFF - all rights reserved.