As we’ve discussed on numerous occasions, running the football in the NFL is an ancillary part (at best) of being a successful football team at the game or season level. Seven of the bottom nine teams in the NFL in yards per carry allowed made the playoffs in 2017, while the worst (the Los Angeles Chargers) finished the season with a winning record. The old adage that you win football games by running the ball and stopping the run is nothing more than noise at this point.
All of this said, the average running play during the 2017 season lost roughly 0.12 Expected Points Added, which was also the average outcome for a run-defender earning a ‘0' (expected) PFF run-defense grade for his team. Thus, simply being an average player in run-defense is valuable in the sense that you are steering an offense’s (on average) suboptimal decision to its (on average) poor outcome. A positive PFF run-defense grade for a defender was worth an average loss of about 0.5 EPA for the opposing offense, which, while less than an analogous grade in pass defense, is still extremely valuable.
In evaluating college players for their suitability at the next level, it’s important to see if success in run-defense at the college level, as evaluated by PFF, maps to success in run-defense at the pro level. We do this in two ways: PFF grades and run-stop percentage. A run stop (worth an average of 0.5 EPA for a defense) is any play in which a defender tackles a ball carrier for less than 45 percent of the yards to gain on first down, 60 percent on second down and short of a first down on third and fourth down.
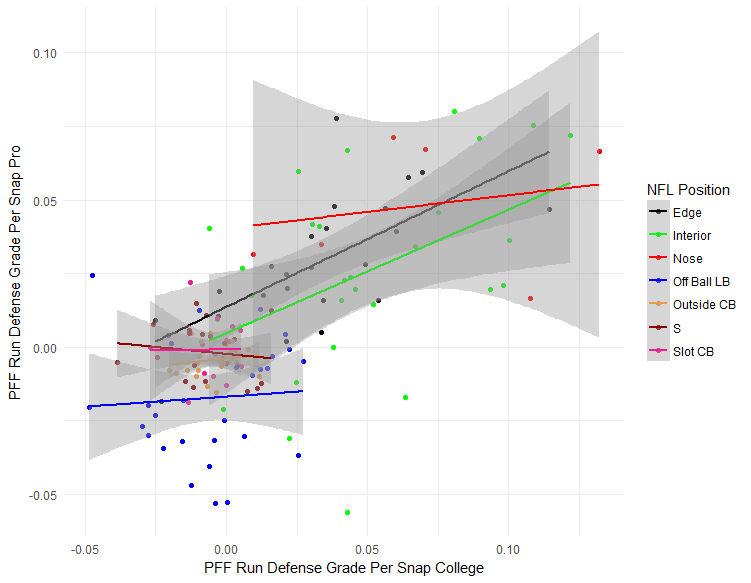
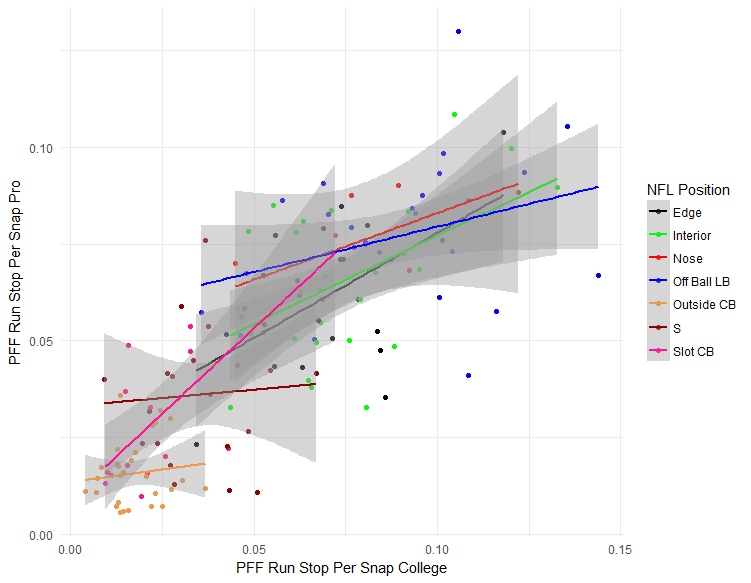
We found that raw PFF run-defense grades at the college level correlated to PFF run-defense grades at the NFL level at a rate of 0.65 (n = 152 players with more than 250 snaps at the NFL level with college data from 2014-2016). This is slightly less than what we found when studying pass-rushers last week, but still strong for football. Using raw PFF grades at the college level correlates at a rate of 0.39 with run-stop percentage, which is nowhere near the 0.80 rate at which run-stop percentage correlates with itself from college to pro. Interestingly, there is some statistical signal for missing tackles at the college level that translates to the pro level (0.44), but those for PFF grades and productivity as run-defenders eclipse it.
While signs are encouraging, it’s interesting to note that not all run-defense is created equally throughout the various positions. Using our player participation data and clustering, we grouped players by their general position, with clusters for edge players, interior players that are not nose tackles, nose tackles, off-the-ball linebackers, slot cornerbacks, outside cornerbacks and safeties. Much like for pass-rushing, the strongest correlations existed for edge and interior players (the black and green lines), while linebackers were more productive at the NFL level than they graded (see the blue line below), and production at the college level translated far better than grades did through three years. In general, the further away from the ball, the noisier the conclusion in terms of how run-defense projected from college to pro.


We also tested combine data to see how well it can predict the larger sample of over 900 players for whom we have PFF grades at the NFL and a sufficient number of snaps. Given this sample we can get an R-squared value of 0.41 using only combine metric to predict a players NFL run-defense grade.
When we pare down the sample to players with run-defense grades at both levels we get an R-squared of 0.38 on 154 players with both college and pro PFF data (minimum 250 run-defense snaps). While the difference is not massive, if we take out a player’s run-defense grade from the set of predictors, we will lose some predictive power with an R-squared of 0.36. With a small sample it is hard to expect much in the way of prediction and this small increase on the out of sample test set is bolstered by an increase of 0.08 in the R-squared value of the training dataset when a player’s college grade was included. Again the dataset is miniscule compared to the ideal size for making predictions, but the stability in grade from college to pro adds credence to the limited confidence we have in making hard and fast predictions.
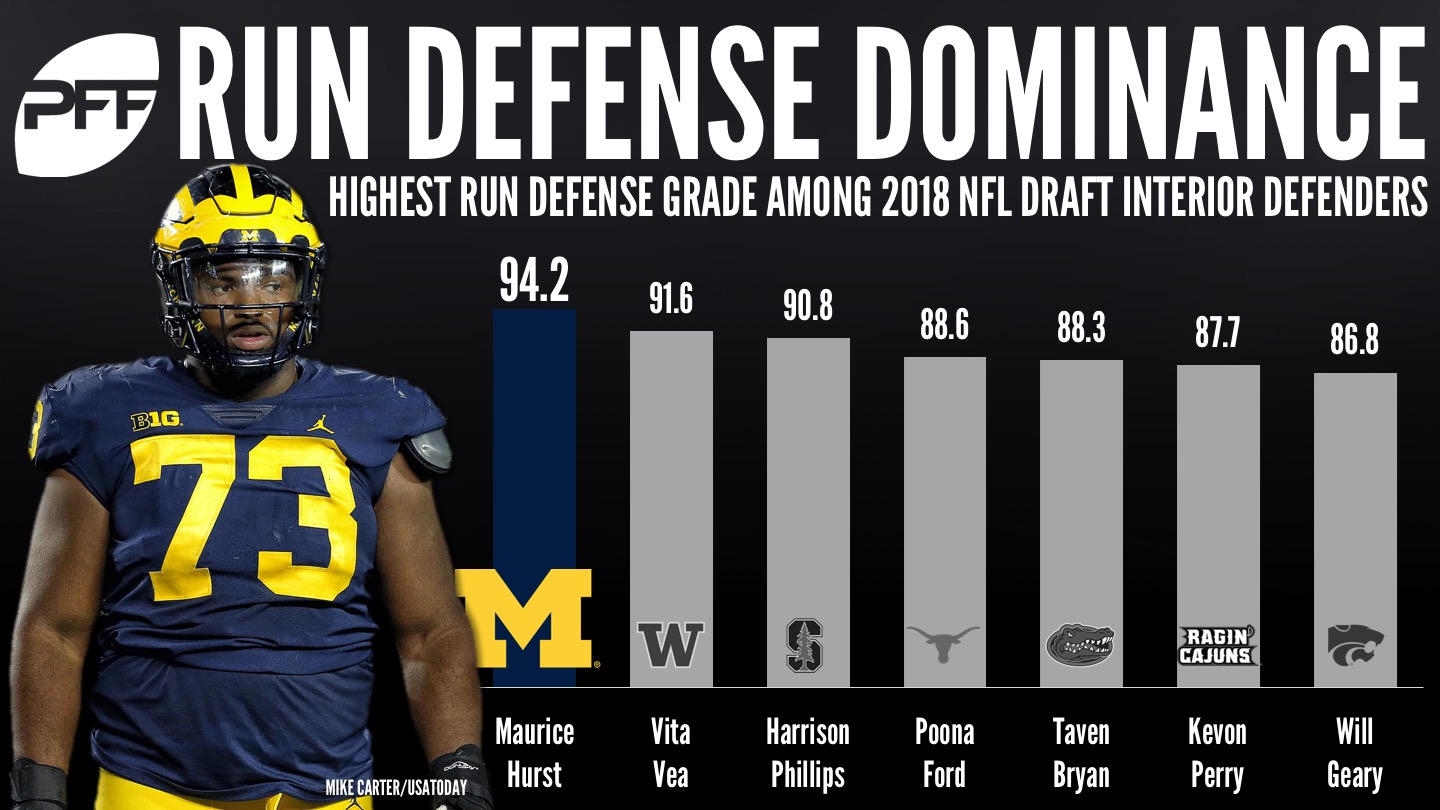
Without ascribing a particular value to where prospects will end up, it is still worth looking at the players in this class who can provide value in run-defense, whether that be in addition the more valuable pass-rush component or in spite of not being very productive in that facet. The most obvious choice here is Michigan’s Maurice Hurst who earned the highest run-defense grade per run-defense snap during his college career. Hurst had been labeled “undersized” by those wielding a pen from their oversized desk chair, and brings tremendous production as a pass-rusher in addition to his strong play against the run. We’ll leave you to ponder what other interior defender dealt with the same “issues” and now represents a massive issue for opposing offensive lines, most of which reside on the left coast.

If you want to hear more about leveraging PFF data to make smart decisions both in the draft and elsewhere, check out the PFF Forecast and send us questions by leaving a review on whatever platform you use.


 © 2025 PFF - all rights reserved.