As we wrote about a week ago, passing the ball and stopping the pass are the most important aspects of football. While the quarterback is generally the straw that stirs the drink for teams offensively, players on the other end of their passes need to possess the requisite talent to make the most of their signal-caller’s talent.
With draft weekend upon us, we continue our series of deep dives into what Pro Football Focus grades and data at the college level mean as they translates to the NFL. We have three years of PFF college grades and data for players that have subsequently played in the NFL, which amounts to 164 total players with at least 75 routes run in each setting.
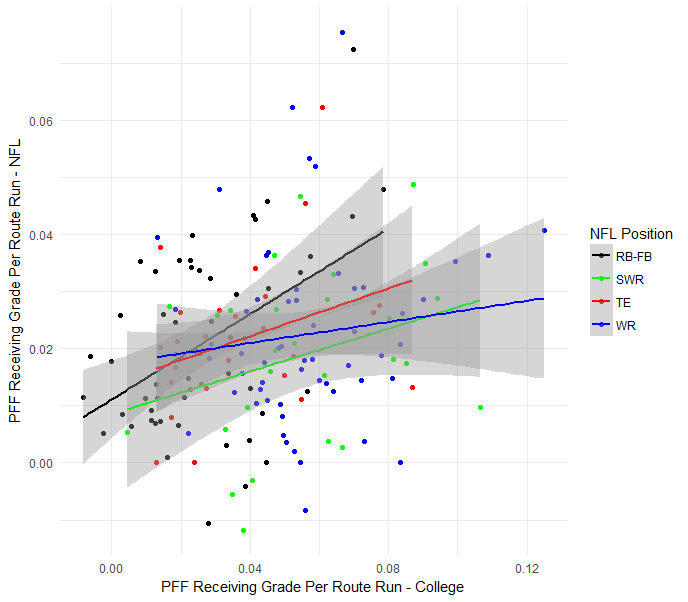
Initial results were somewhat surprising, as PFF receiving grades earned per route run for all players correlate from college to pro at a rate of about 0.25, which is roughly half of the year-to-year correlation in PFF receiving grades for players already in the NFL, suggesting that the learning curve in terms of catching the ball at the NFL level is far more steep than that for things like run-defense or pass-rushing. Yards per route run, one of our signature stats for pass-catchers, is even less predictable (0.07), while catch rate (0.50), yards per reception (0.43) and yards after the catch per reception (0.49) translate more easily to the NFL level.
Positional Influence
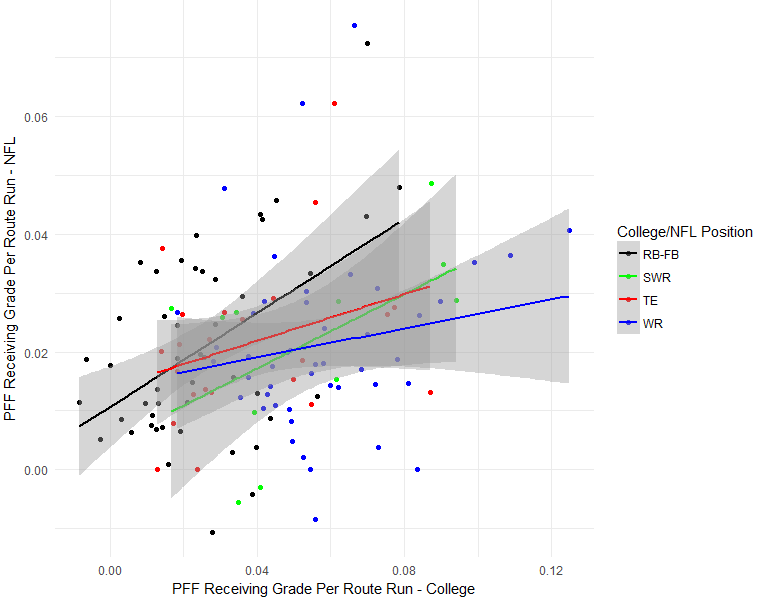
As with pass coverage players, combining all receivers into one group has the advantage of increasing the sample size, but lumps together the play of individuals who are asked to do drastically different things. We clustered players into position groups using our participation data. For receivers, these players clustered into outside receivers, slot receivers, tight ends and running backs. 130 of the 164 original players in our sample fell into the same position cluster in the pros as they did in college.
As with coverage, among players who played in the same position in college and as pro, most of the pertinent metrics became more predictive, specifically PFF receiving grade per route run (0.29), yards per route run (0.09), catch rate (0.57), yards per reception (0.49). The year-to-year correlation in PFF grade earned per route run is still substantially less than it is year-to-year for pro players, though, suggesting again that, even among players playing familiar roles, the learning curve is steep for receivers.
Interestingly, yards after the catch per reception stayed as predictive as when using the larger sample, suggesting that that is a trait that transcends positions (except running backs, where yards per catch and yards after the catch per catch are oddly uncorrelated from college to pro at 0.01 and -0.03, respectively).
About Running Backs…
As we discussed Tuesday on the PFF Forecast, pass-receiving prowess for running backs (at least as measured by PFF grades and per-route metrics) is more predictive than it is for other positions. PFF grade per route run correlates at a rate of 0.48 from college to pro, and yards per route run correlate at a rate of 0.28, which are far higher than for the group as a whole. Thus, so far we know more about how running backs will do in the passing game at the NFL level from how did they did in college than we do for wide receivers and tight ends.
Does that mean the running back position is more valuable than we thought? Not so fast.
As we’ve written about previously, whether looking at it from where the receiver lines up to what his stated position is, throwing to running backs is worth far fewer Expected Points Added (EPA) per target than throwing to positions like wide receiver or tight end. Furthermore, a +0.5 PFF grade from a wide receiver or tight end is worth more than 1.30 EPA for his team (and 1.40 if from the slot), while those for running backs are worth 1.11 EPA. Outside receivers generate these +0.5-graded plays 2.5 times more than running backs do, while slot receivers generate them about 1.7 times more. Thus, while it is encouraging that we are able to capture the skillset of a running back in what his most important role (the 1.11 EPA on positively-graded receiving plays is about twice as valuable as similarly-graded run plays), it comes with the caution of his limited value at the NFL level.
Combine
Using height, weight and combine numbers, we saw pretty miniscule predictive power with respect to PFF grade in the pros, with just a correlation of 0.22 (on a sample of 767 players from 2006 to 2017). Looking at this by position (see table below) we see that stability is highest for slot receivers (0.37) followed by tight ends (0.32).
Correlation between Combine Metrics and PFF Pro Grade
| Position | N | Correlation |
| All | 724 | 0.22 |
| WR | 222 | 0.20 |
| Slot WR | 139 | 0.37 |
| TE | 143 | 0.32 |
| RB-FB | 225 | 0.25 |
Tight ends and backs saw the largest pick up from the addition of college grades to the combine data, while there was little additional help provided by college grade for college slot receivers. For the 106 players who remained at their college position in the pros the correlation grew to 0.44.
As we did with coverage players, we used the most important variables (as mentioned above) to create athletic clusters for each position and see whether particular clusters were more or less stable.
| Cluster (ordered by NFL grade) | N (same pos) | Avg. 40 | Avg. HT | Avg. Vert. | Avg Broad | Correlation |
| 1 | 27 (23) | 4.49 | 73.8” | 35.8” | 125” | 0.28 (0.49) |
| 2 | 14 (9) | 4.51 | 71.4” | 36.1” | 120” | 0.61 (0.65) |
As one might expect, the more impressive athletic cluster earned a substantially higher mean grade in the NFL and those receivers who stayed in the WR cluster showed good stability from college to pro. As we’ve seen before, the most stability doesn’t often mean the most value and, here again, the more stable cluster is the one that performed the least admirably in the NFL. A cautious takeaway here is the importance of the broad jump once again. Michael Thomas stands out as the most pronounced success story from the Cluster 1 subset.
With college slot receivers, the 40-yard dash showed more difference between the two clusters than it did with wide receivers. The second cluster was substantially more stable, but that stability comes at the cost of much lower production. A couple of players who fell into the first slot cluster, Nelson Agholor and Stefon Diggs are examples of the higher value that comes out of Cluster 1. Agholor is an example of a player who found his NFL success when he transitioned into the slot role that he played in college which is not surprising considering the drastic uptick in correlation when looking only at Cluster 1 slot receivers that fall into the same position cluster in the pros.
| Cluster (ordered by NFL grade) | N (same pos) | Avg. 40 | Avg. HT | Avg. Vert. | Avg Broad | Correlation |
| 1 | 6 (6) | 4.63 | 76.1” | 33.3” | 120” | 1.0 |
| 2 | 13 (13) | 4.83 | 76.8” | 31.8” | 116” | 0.70 |
Conclusions/Prospect Discussion
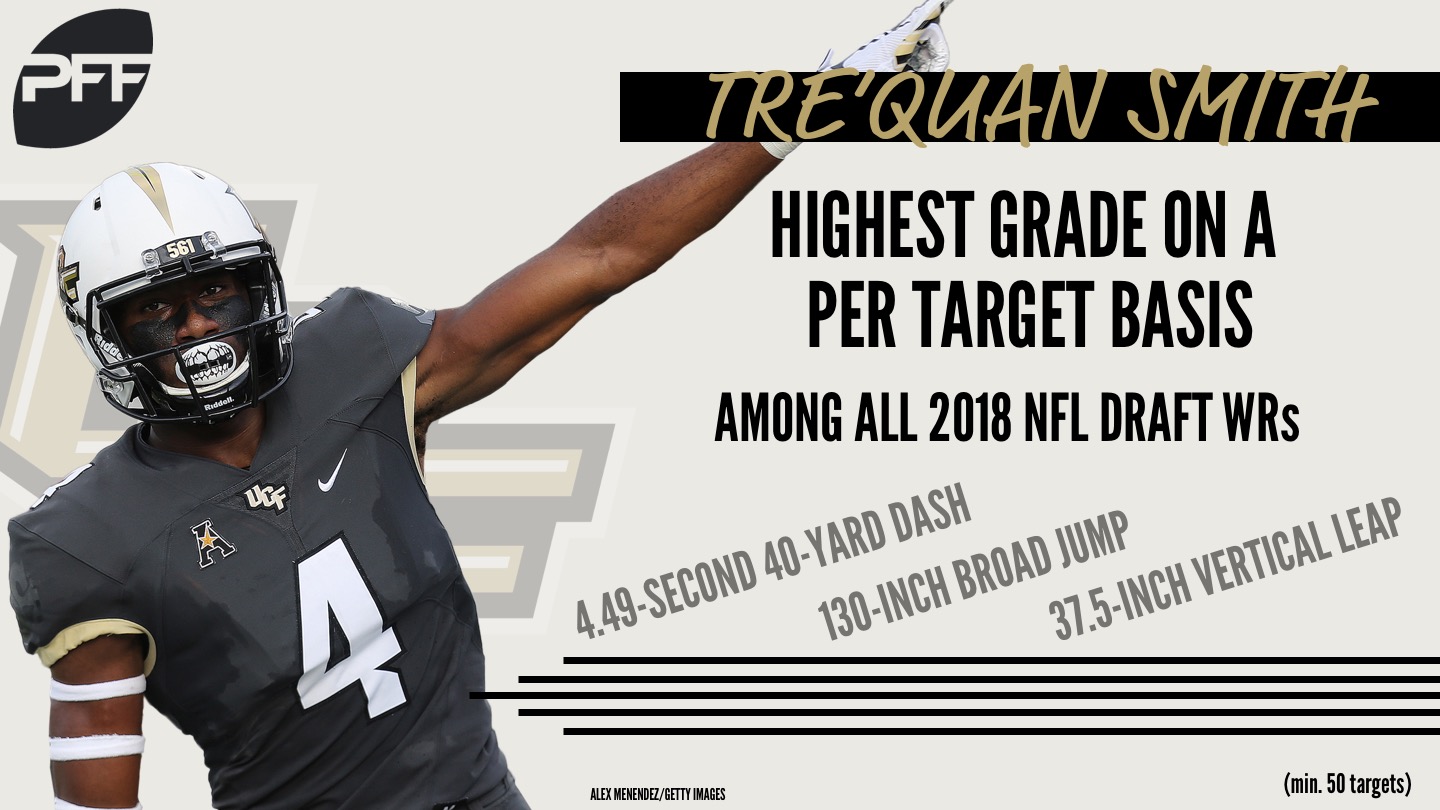
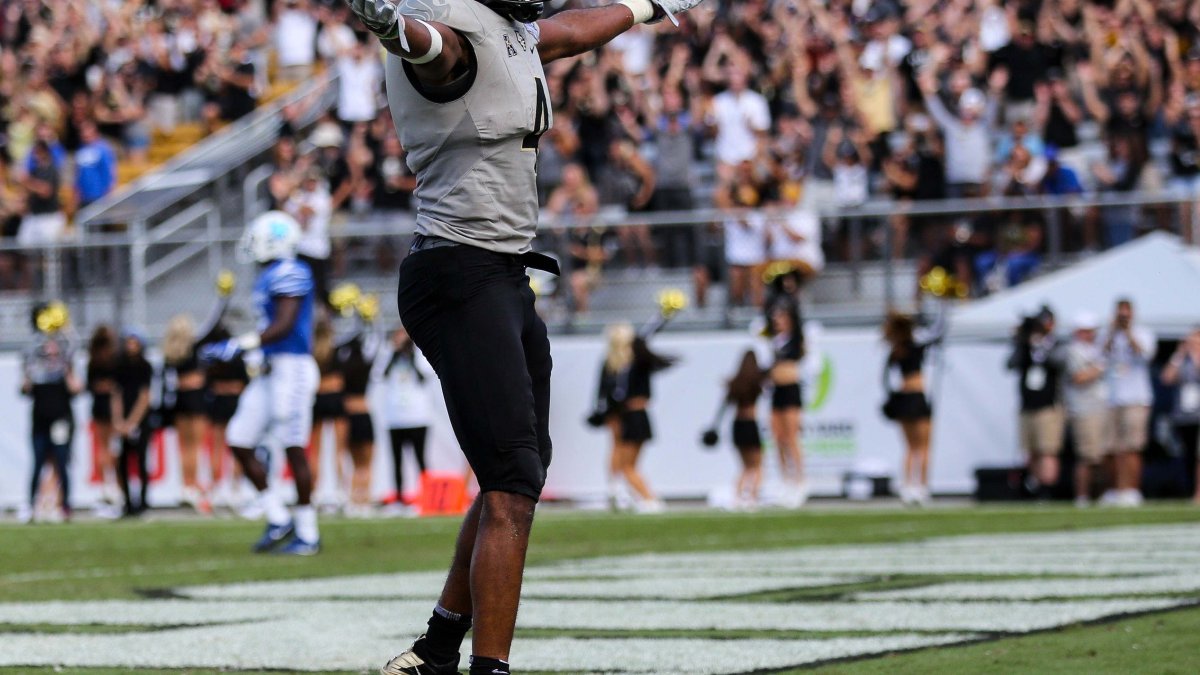
Tre’Quan Smith out of UCF fits the Cluster 1 wide receiver bill with his 4.49 40-yard dash, 130-inch broad jump, and 37.5-inch vertical. He finished third in deep pass yards and deep pass receptions but most importantly he had the highest grade per target of any receiver in the draft class with at least 50 target in 2017. Currently 13th on the PFF big board, Smith figures to offer substantial value especially considering the likely price.
At the tight end spot, South Dakota State’s Dallas Goedert took 368 routes and turned them into 1,103 receiving yards to lead all collegiate tight ends in efficiency. He was also solid on his 144 routes from the slot, generating 2.62 yards per route run there. His college production, coupled with the athleticism displayed by a 10-foot-1-inch broad jump at his pro day, make him the consensus top player at the position going into today’s draft.
For more college to pro discussion listen to the PFF Forecast and send questions for @PFF_EricEager and @PFF_George to answer on the podcast by submitting a review on iTunes.


 © 2025 PFF - all rights reserved.