The 2020 North Carolina Tar Heels featured two of the nation’s top running backs in Michael Carter and Javonte Williams, who racked up 6.7 and 6.4 yards per carry, respectively. However, these players went up against stacked boxes — 7-plus players in the box at the snap — at highly different rates; Williams' stacked box rate was 24% compared to 13% for Carter.

This is where college rushing yards over expected comes into play. Not all rushing yards are created the same way — using a variety of factors listed below, we can account for that.

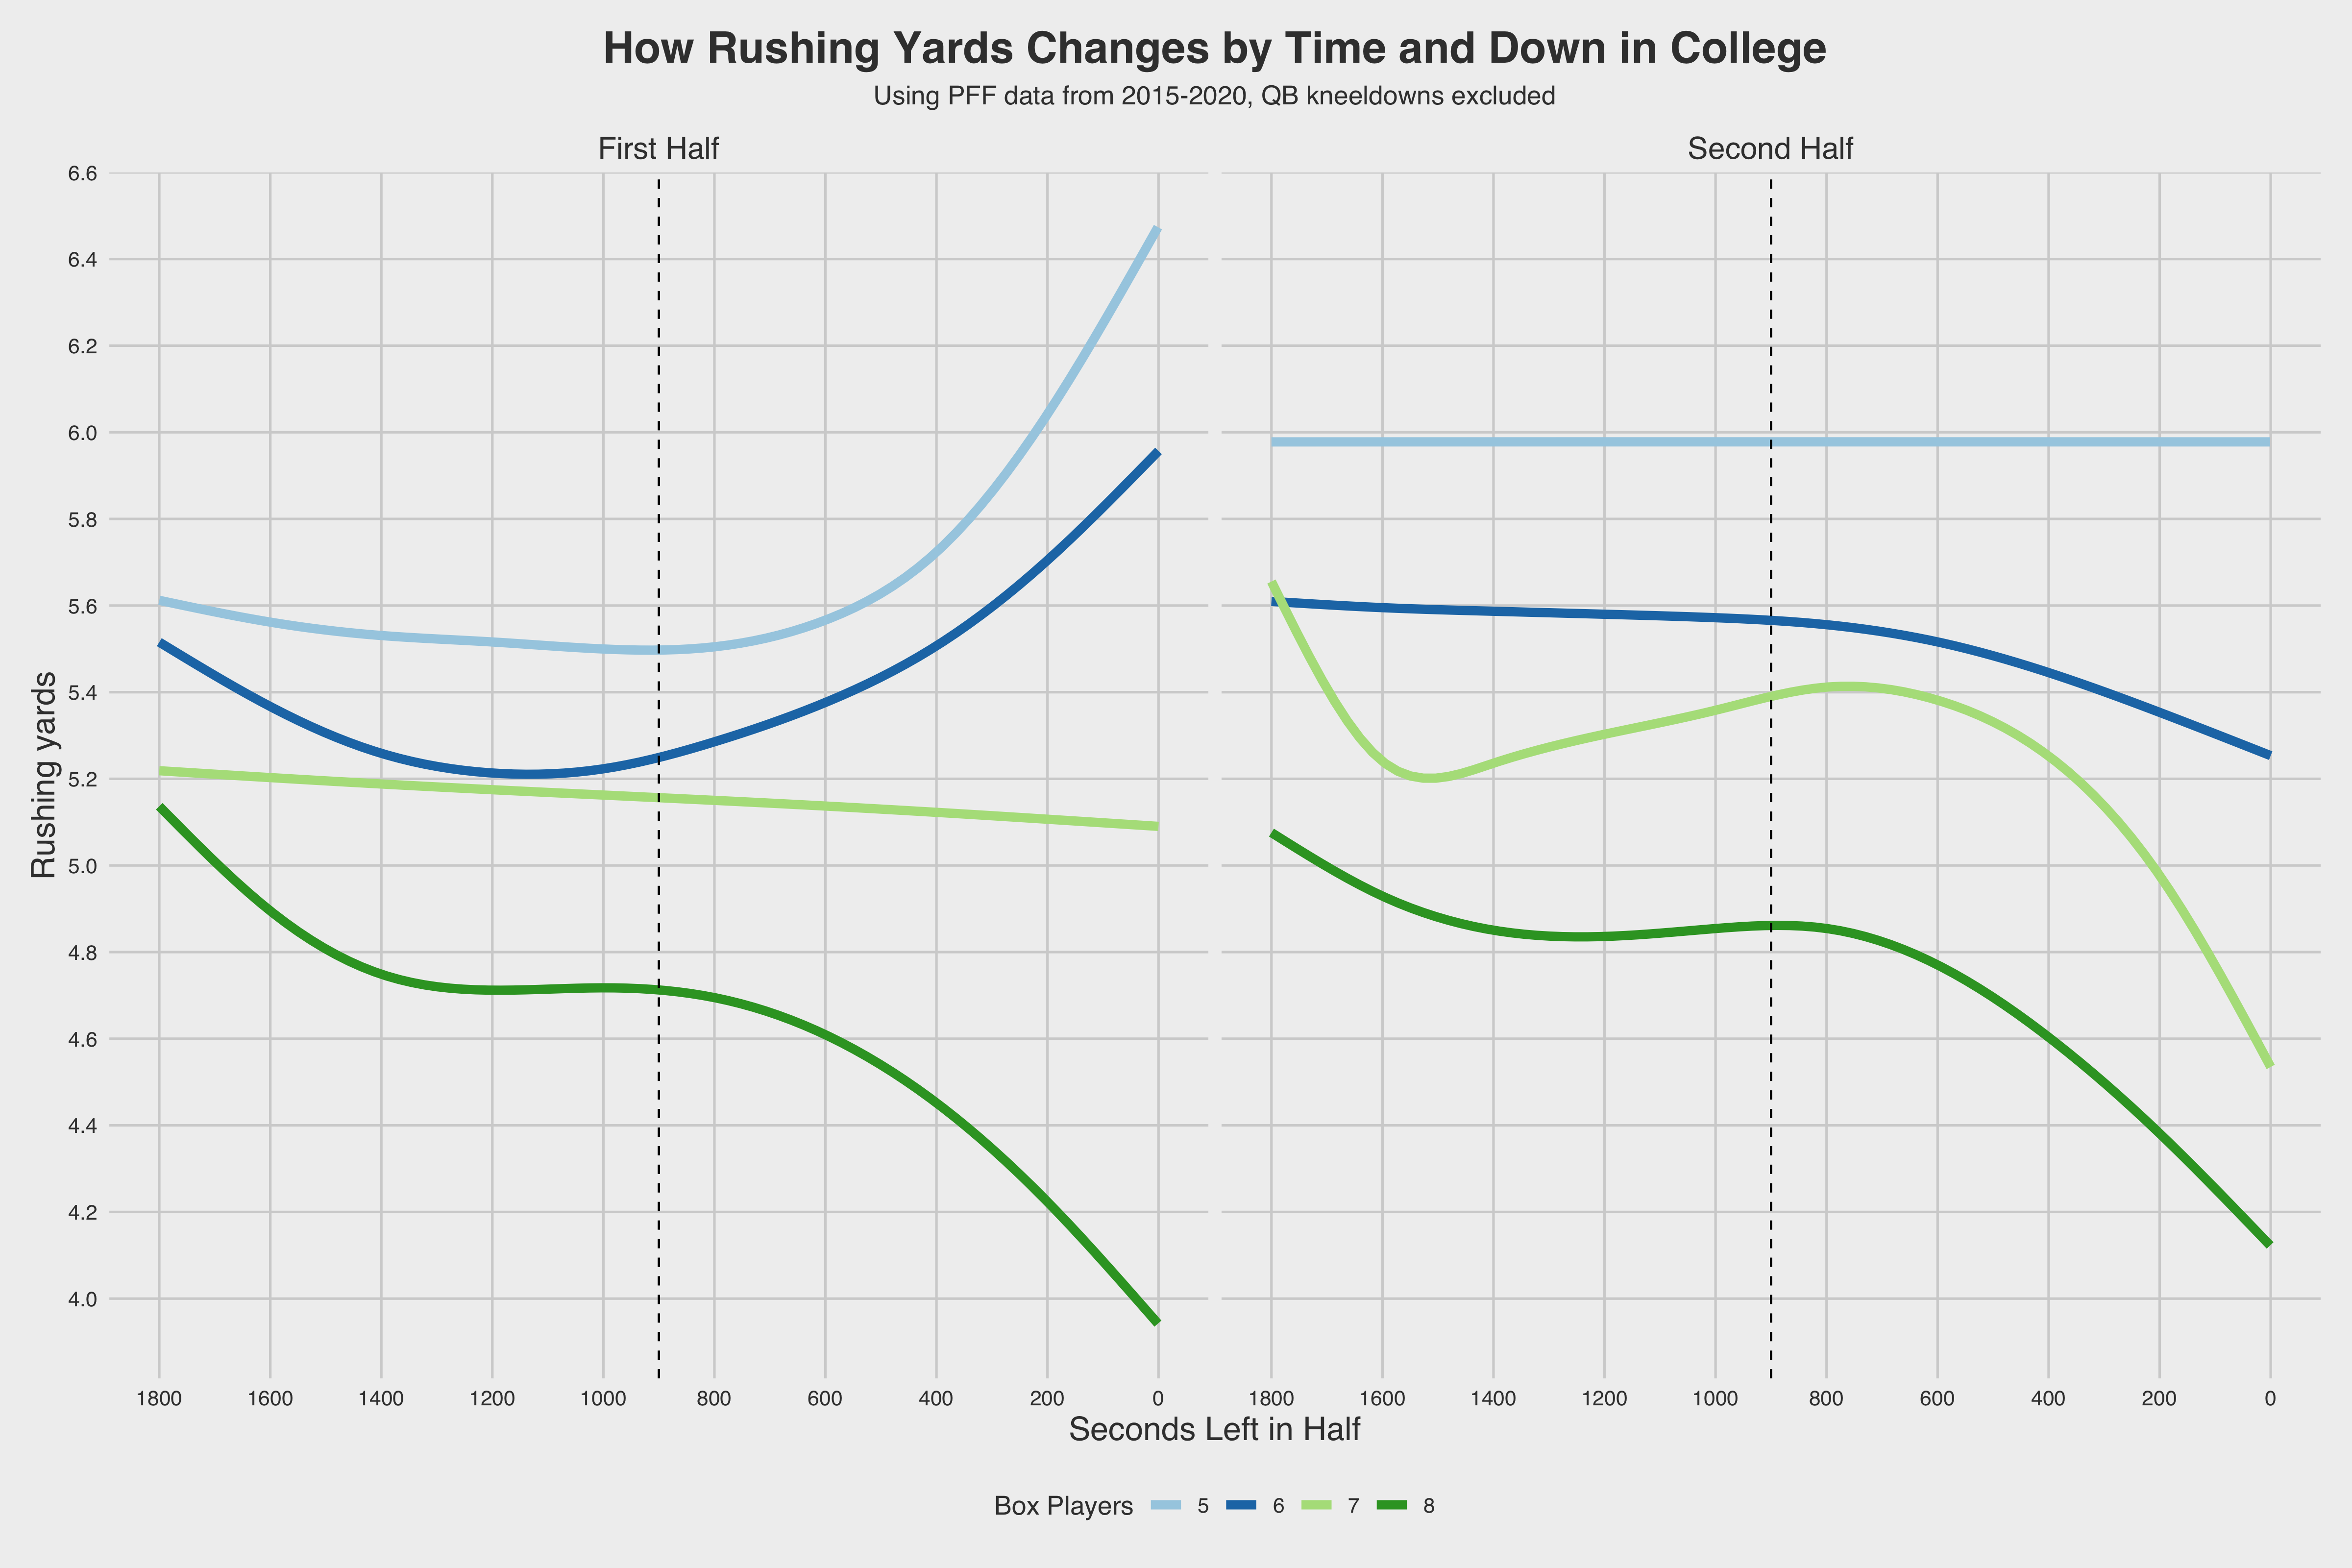
As expected, the number of players in the box has an impact on the amount of rushing yards that occurs. An interesting finding was how big of an impact seconds left in a half plays into rushing yards. In the first half, rushing becomes tougher against eight-man boxes but easier against five- and six-man boxes as time goes on. In the second half, five- and six-man boxes stay stagnant no matter the time, while seven-man and eight-man boxes see a steep decline in rushing yards as the half progresses.

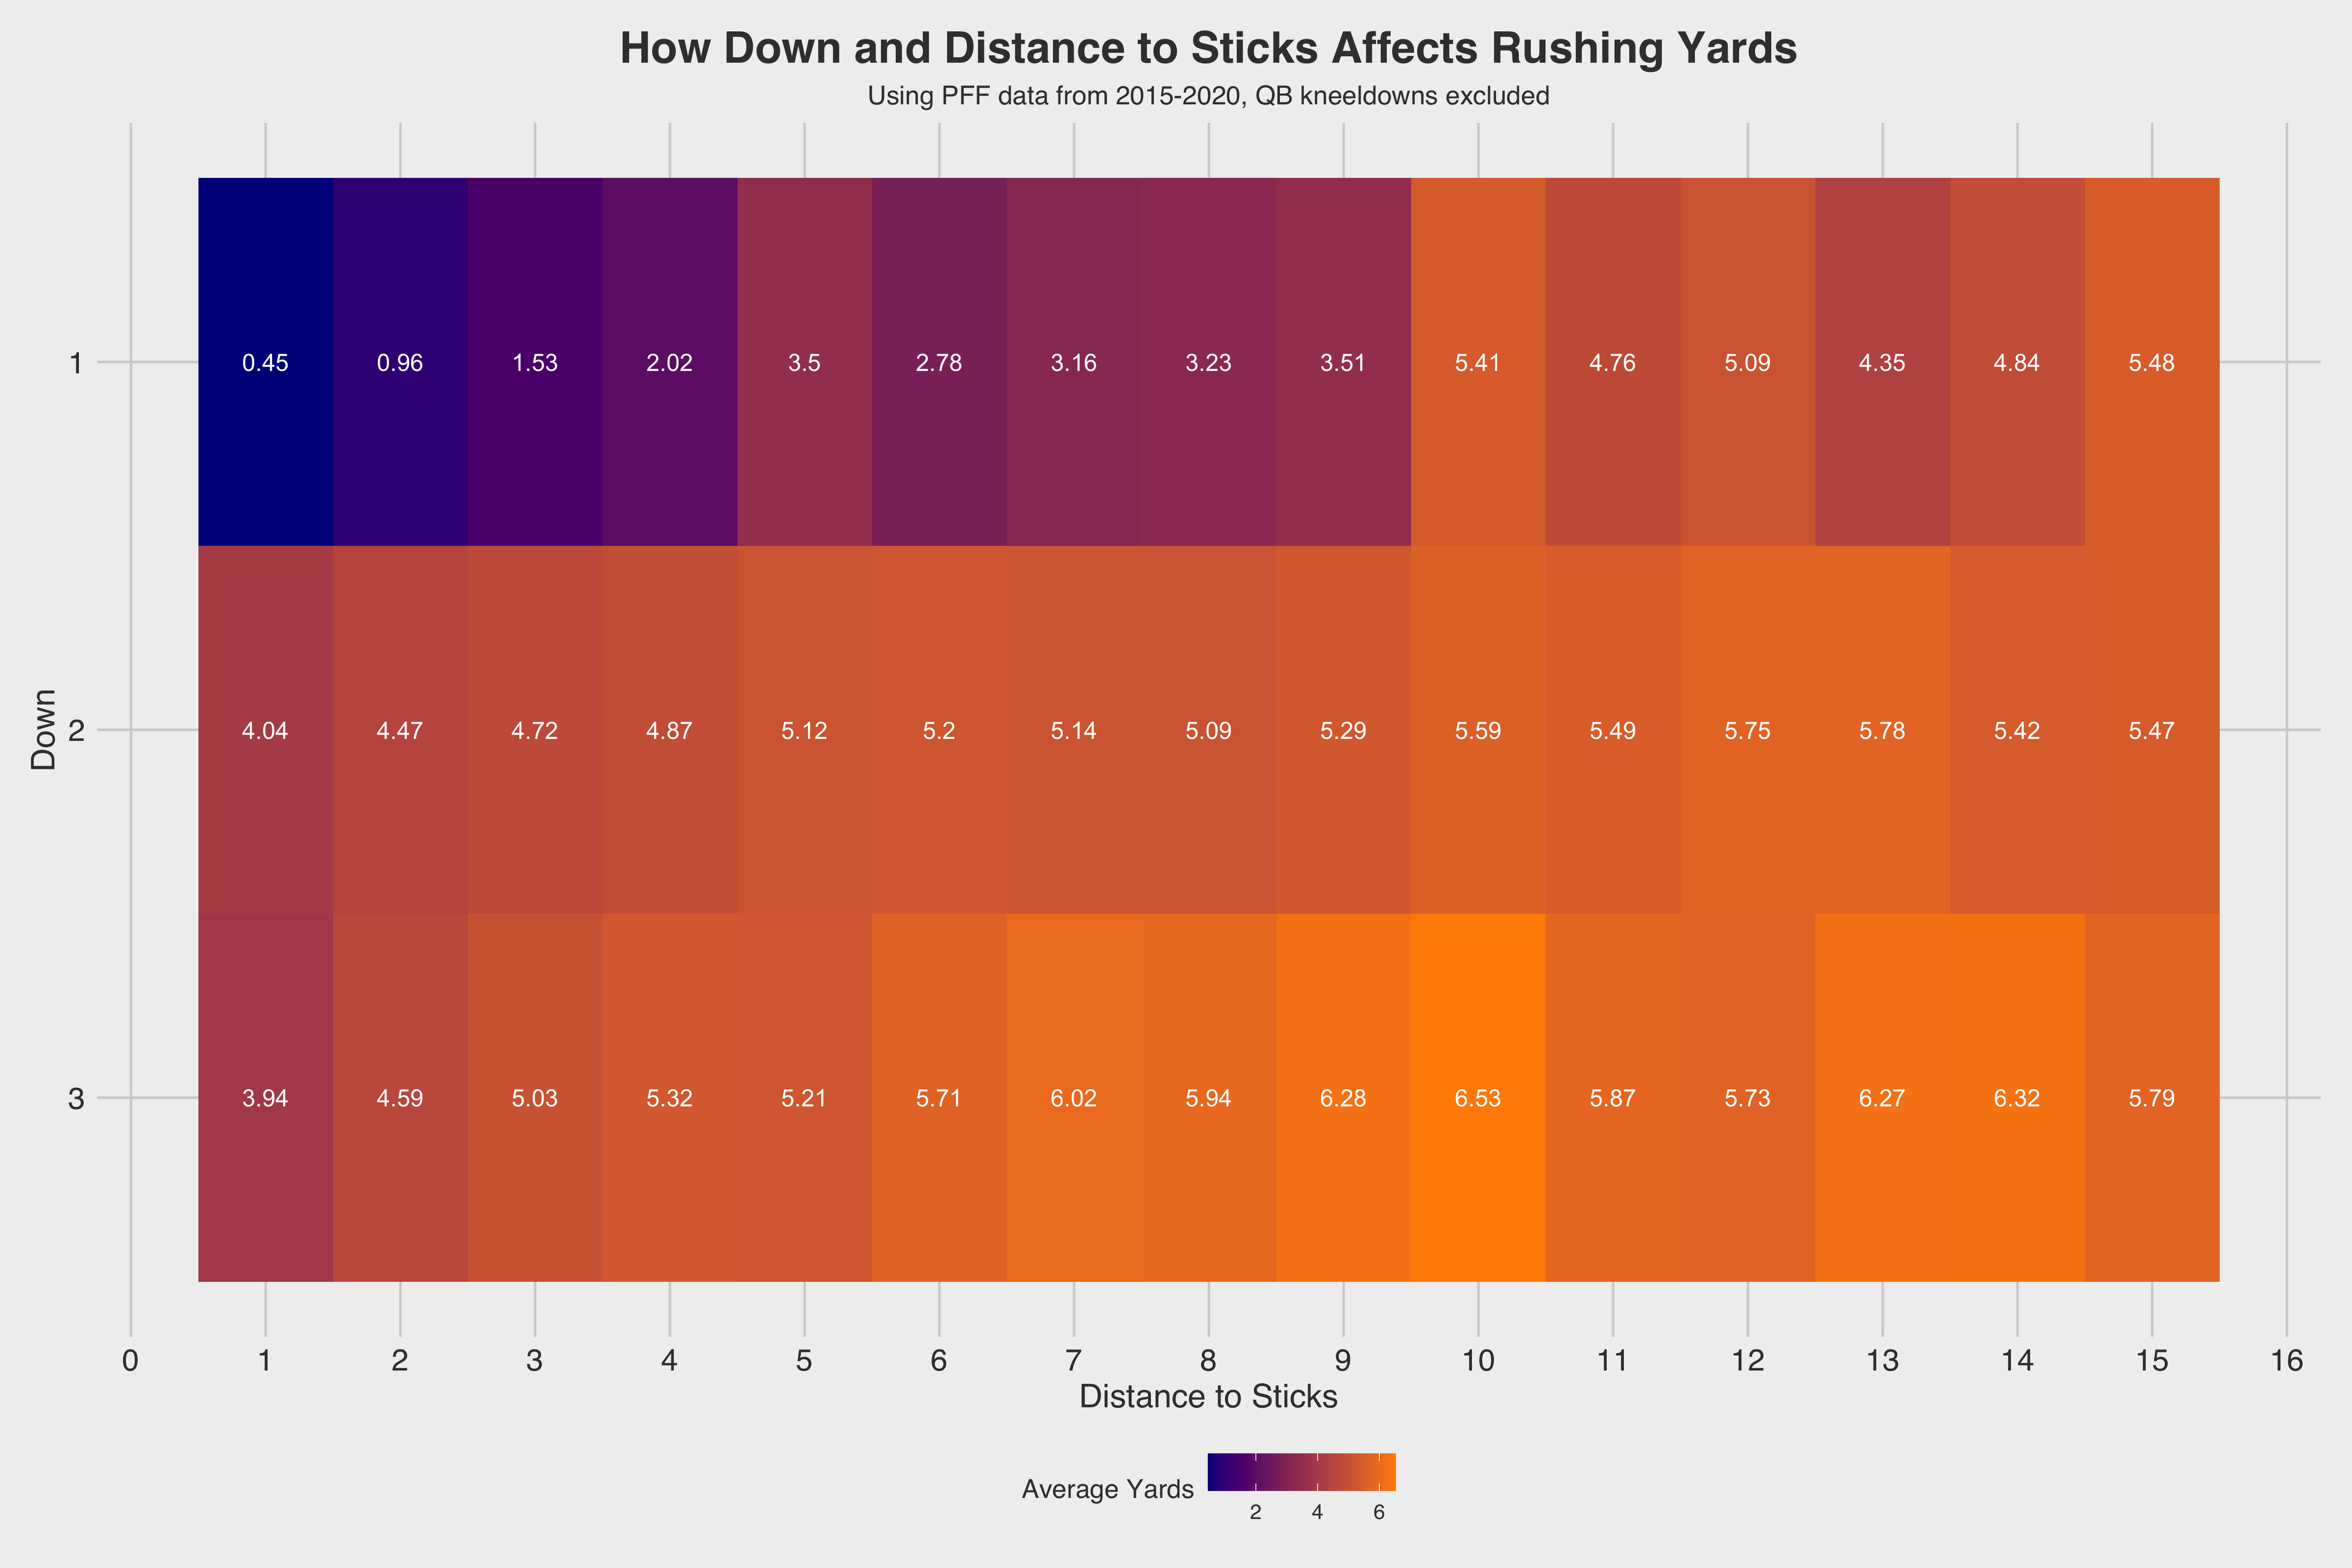
Similar to Expected Points Added (EPA), down and distance is also accounted for in the expected rushing yards model. It’s much harder to rush on a third-and-1 (3.94 yards per carry) than second-and-10 (5.59 yards per carry). Using all of those features, we can calculate college rushing yards over expected (RYOE). It’s important to note that because of the scarcity of college tracking data, this RYOE model is solely built off game situation.
Exclusive content for premium subscribers

WANT TO KEEP READING?
Dominate Fantasy Football & Betting with AI-Powered Data & Tools Trusted By All 32 Teams
Already have a subscription? Log in


 © 2025 PFF - all rights reserved.