Quarterback is the most important position in team sports, and while it’s possible for a great all-around team like the Philadelphia Eagles to win the Super Bowl with a backup quarterback like Nick Foles (though he certainly didn’t play like it in the last two games), the vast majority of continuously-contending teams consist of both stability and efficacy at the position.
With the league’s current CBA in place, acquiring a quarterback that can play, and play well right away yields a substantial value. When Russell Wilson led the Seahawks to two Super Bowls (and one title) from 2013-2014, he did so with a salary under $900,000 both years, allowing the Seahawks to build and maintain the league’s best defense during that stretch. Carson Wentz’ 2017 salary was just over $6-million, allowing the Eagles to make a number of moves for veteran players that were key to their success. The Rams seem to be doing the same while Jared Goff is under his rookie deal.
There is a great deal of meaningless noise this time of year, and no shortage of opinions. With the benefits of drafting a championship-caliber quarterback clear, we set out to answer the question of whether our PFF College data, through four seasons of data collection, has anything to offer in terms of pointing us in the right direction at the position. We first look at how predictive grades have been from college to pro and then to signature stats. We then speculate on how subsets of a quarterback’s throws would translate to the next level, and discuss how accuracy charting can contribute to the conversation moving forward.
PFF Grades
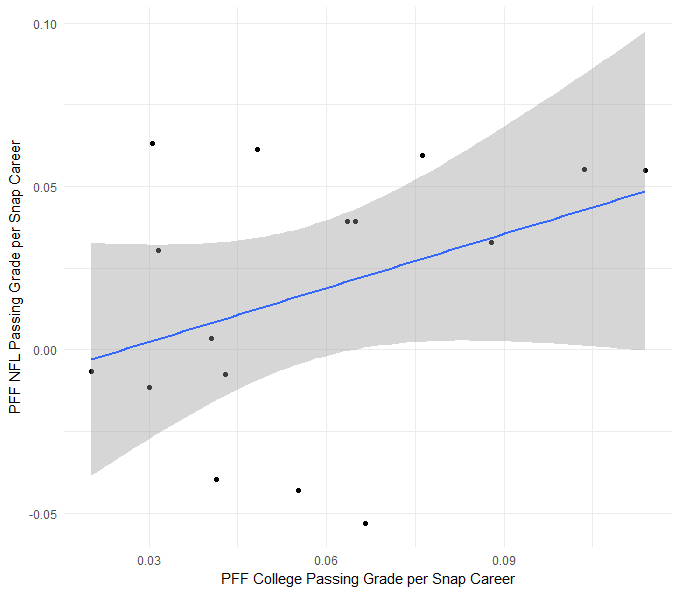
To date, we have four years of PFF grades for college quarterbacks, which translates to 16 quarterbacks that have thrown at least 100 passes in the NFL (including playoffs) that also have PFF College data. Among those quarterbacks, raw PFF passing grades per snap in college are reasonably predictive of passing grades in the NFL (with correlation coefficient equal to 0.37). This relationship stays roughly the same if the NFL pass threshold grows to 200 (0.37, n = 14) and 250 (0.45, n = 10). While efficiency metrics like yards per attempt and (especially) Josh Hermsmeyer’s PACR have predictive power at the NFL level, they are weakly predictive of pro success in this small sample. The rate at which a quarterback throws +0.5-graded throws, and positively-graded throws in general, have correlation coefficients between 0.45 and 0.55 in this dataset, while negatively-graded throws are a bit less predictive (between 0.05 and 0.40 depending on sample size).

PFF Signature Stats
As we did with PFF grades, we looked first at the entirety of a quarterback’s dropbacks. This gives us the largest possible set of throws in a less than ideal sample size of quarterbacks.
First, we compared the stability of both normal completion percentage and PFF’s adjusted completion percentage (accounts for drops and other non-aimed passes). Since adjusted completion rate is fairly sensitive to drops, throw-aways and other situations that are rare but do get excluded from the denominator, we looked at the 10 quarterbacks with a minimum of 250 attempts in their NFL careers. Completion percentage had a 0.26 correlation from college to pro while adjusted completion rate came in as a more stable metric with a correlation of 0.35. Intuitively this makes sense – the better we drill down to a quarterback’s true accuracy, the better we would expect that value to translate at the next level. Unsurprisingly, adjusted completion rate is still not as stable as PFF grade (0.45) which is able to much more accurately measure a quarterback's performance on a given play (for more detail you should read the article by our Senior Analysts Steve Palazzolo and Sam Monson).

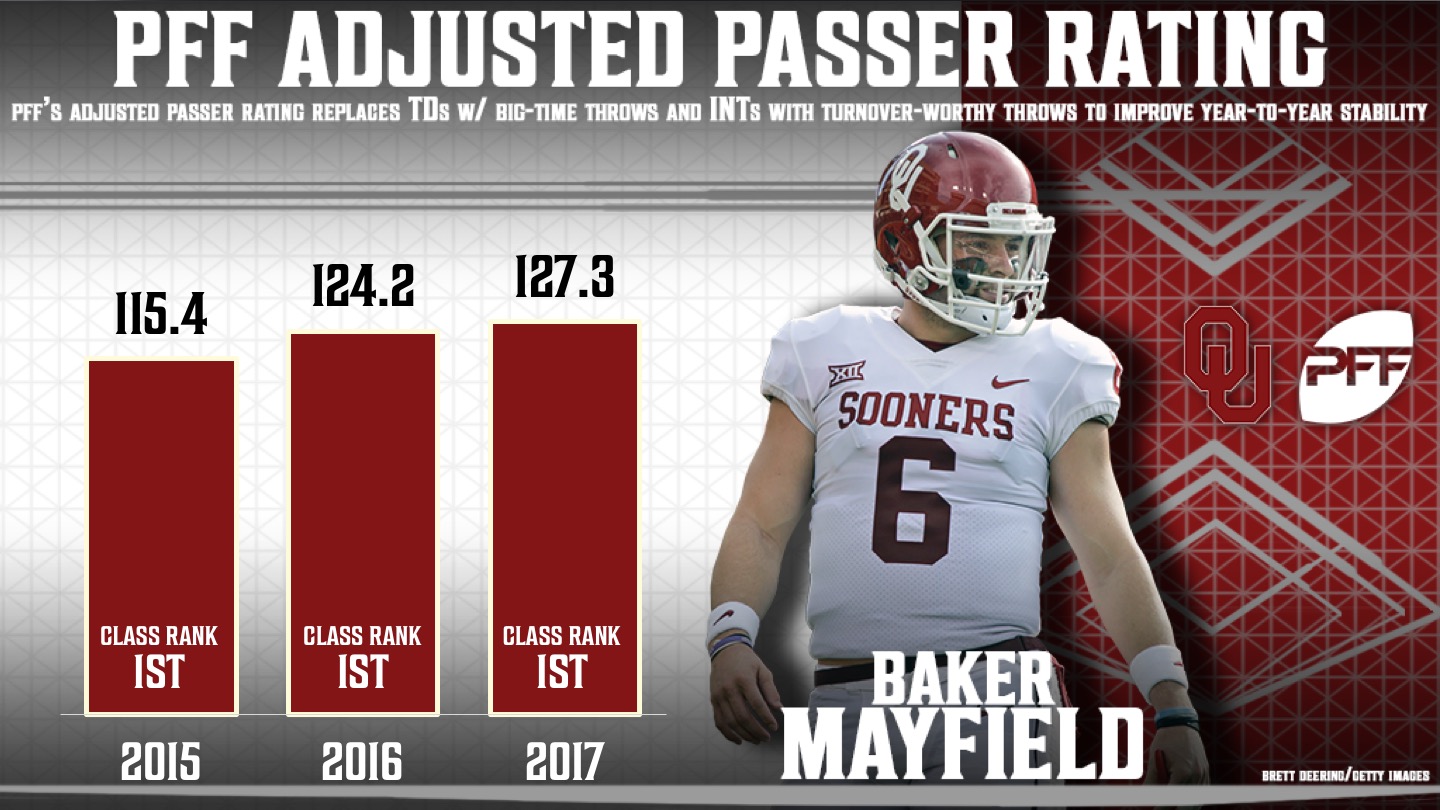
Next, we compared the stability of NFL passer rating and the adjusted NFL passer rating that we wrote about a few week back. To adjust passer rating, we replaced touchdowns and interceptions, both of which are not stable year to year, with big-time throws and turnover-worthy throws (for more info, go read Steve and Sam’s article) which are far more stable. Again passer rating is quite volatile in low sample sizes to touchdowns and interceptions so we limited ourselves to the 10 quarterbacks who have exhibited the most grit and managed to accrue at least 250 pass attempts in the NFL. The relationship between regular passer rating from college to pro was not very strong (0.17) while the college to pro correlation of adjusted passer rating is more than double that figure at 0.34. The increased correlation from incorporating the more stable grading elements is validating though it still falls a little short of PFF passing grade.
Speculation
At the NFL level, we know that certain scenarios simply don’t matter from a predictiveness standpoint. A great example of this is NFL passer rating off of play-action. Passer rating with play-action is correlated at a rate of just -0.02 season to season (yes that is as un-predictive as it seems). This is in stark comparison with performance from a clean pocket where the season to season correlation for passer rating is 0.42. Given our small sample of quarterbacks, splitting their throws into scenarios simply makes the data way too noisy to even consider at this point. That being said, we feel strongly that something which has proven to be either stable or unstable at the NFL level is likely to act similarly when moving from college to pro. The early returns back this up soundly, both from the perspective of grades and signature stats, albeit with a very small sample that leaves us unwilling to disseminate anything concrete.
Quantifying “NFL Throws”
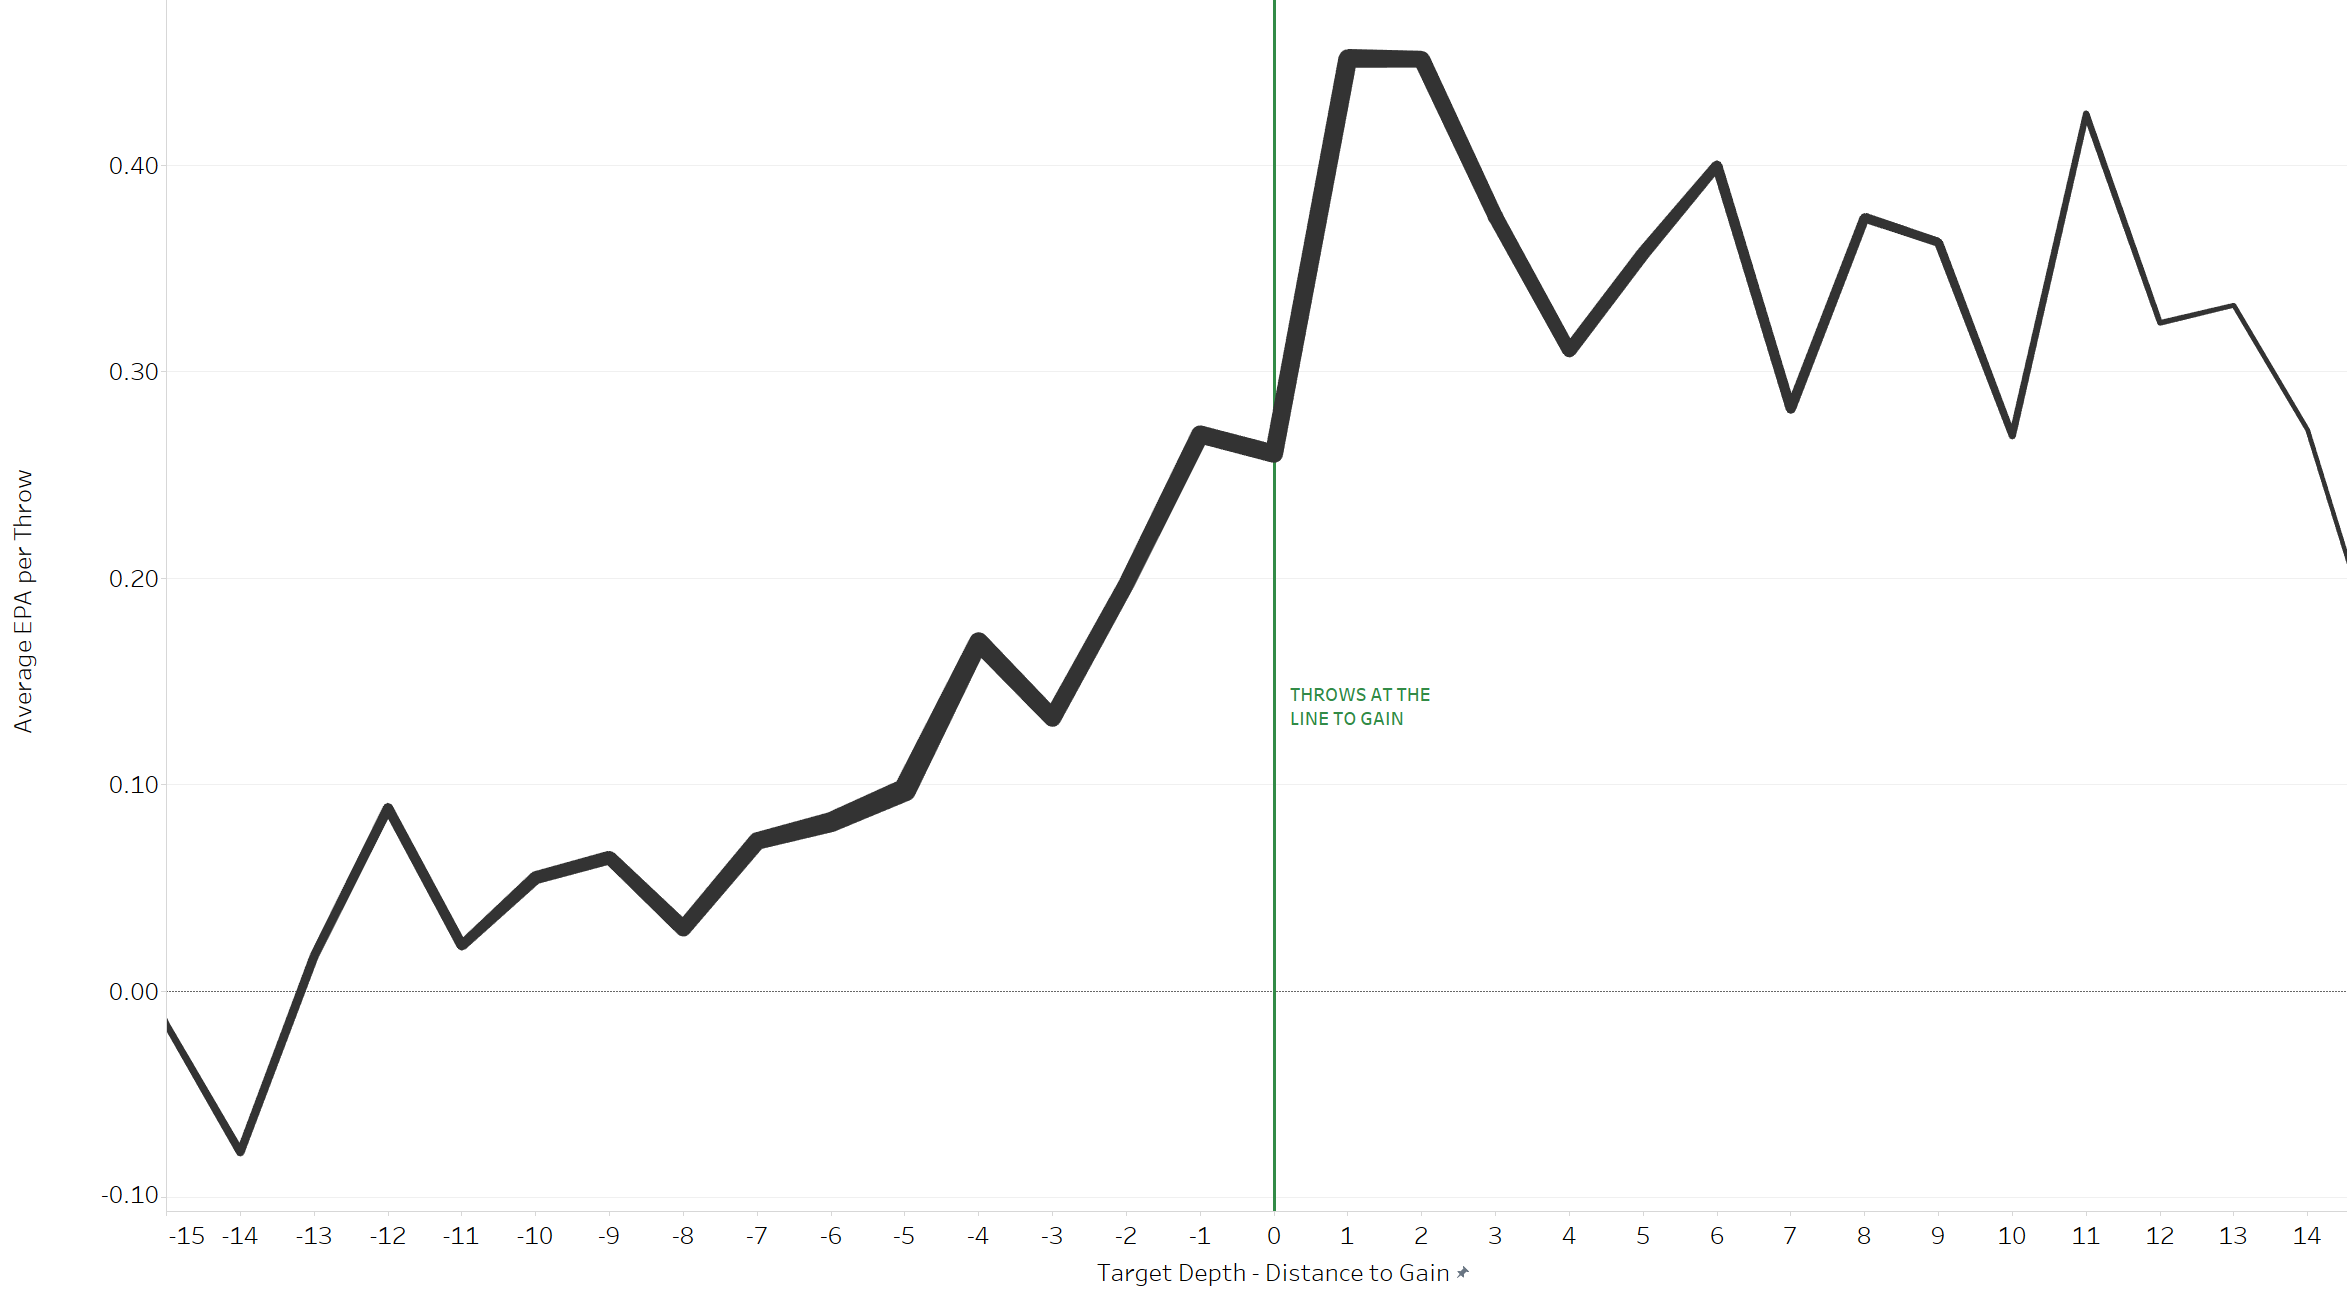
As we’ve discussed on the PFF Forecast and written about in the QB Annual, one of our next projects is to classify which throws are differentiators at the NFL level. The goal was to generate a concrete subset of throws that we call “NFL Throws” and are characterized by their higher variance in terms of value generated (using EPA), grade per throw and accuracy (using actual ball location charting). The rest of the throws we call “non-NFL Throws” for lack of a better term and are generally the throws that have much less variance in those aforementioned areas (most quarterbacks perform much the same on them) or are simply very rare. The addition of our charting data (which can be found in the newest QB Annual) allows us not only to better classify accuracy but also to use separation when defining a type of throw. Another important classifier for the type of throw is the target depth relative to the line to gain. As shown in the figure below, the mean EPA per throw dramatically increases when the target of the throw is at or past the line to gain. The importance of these throws is obviously not lost on the defense which contributes to higher variance.

An example of an “NFL Throw” is an over-the-shoulder throw made in-rhythm into tight coverage more than three yards past the line to gain whereas an open crossing route thrown five yards or more short of the line to gain would fall into the “non NFL Throw” bucket. In 2017, the highest-graded passers on NFL throws were:
1. Drew Brees
T2. Tom Brady
T2. Jimmy Garoppolo
4. Russell Wilson
5. Matt Ryan
The first three are also the leaders in the percentage of NFL throws that were accurate with Carson Wentz falling in at fourth.
We can analyze this year’s quarterback class on this subset of “NFL Throws.” Using PFF grade the consensus top-six passers stack up as follows:
1. Baker Mayfield
2. Josh Rosen
3. Mason Rudolph
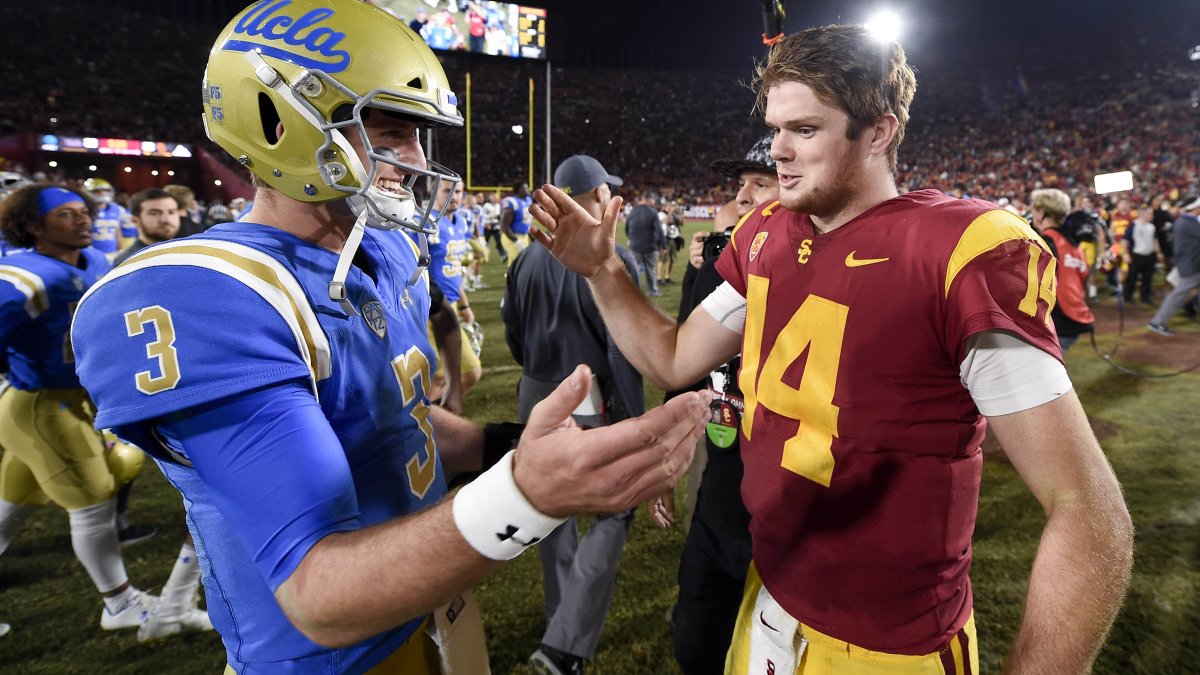
4. Sam Darnold
5. Lamar Jackson
6. Josh Allen
Mayfield was the most accurate on these throws. Darnold was the second most accurate, while his grade was hurt by having the most turnover-worthy throws on NFL Throws this past season.
While the sample is still small we can look at NFL stability to give a sense of what metrics we expect to remain stable from college to pro. Using the 30 NFL passers with at least 50 charted passes in each of the last two seasons we noticed that accuracy rate throwing into tight coverage was very unstable from 2016 to 2017 (0.09). However, throwing to a receiver with a step or more of separation was very stable (0.56). Isolating only the throws with a step of separation or more we can rank the top-six quarterbacks once again:
1. Sam Darnold
2. Baker Mayfield
3. Mason Rudolph
4. Josh Rosen
5. Josh Allen
6. Lamar Jackson
Viewed through this lens, it seems that both Mayfield and Darnold rise to the top of the quarterback class. Taking into consideration the overall grade and it's stability from college to pro, Mayfield seems to get the edge. Certainly there are other arguments to be made for Darnold or others, but we think it’s best to stick to the data that we can quantify most robustly.
If you need a more poetic way to convey this message, we recommend you check out the most recent episode of the PFF Forecast.
2018 NFL Draft
Mock Drafts: 1 (Oct. 31, 2017) | 2 (Jan. 18, 2018) | 3 (March 8, 2018) | 4 (April 3, 2018)
Top 100 Draft Board | Top 10 WRs on the route tree | WR prospect fits | DI prospect fits | Underrated west coast prospects | 5 boom-or-bust prospects
Position ranks: QB | RB | WR | TE | OT | OG/C | EDGE | DI | LB | CB | S
Draft Quarterback Study: Lamar Jackson
Draft Corner Route Trees: Josh Jackson | Minkah Fitzpatrick | Denzel Ward | Donte Jackson | Isaiah Oliver | Carlton Davis
Predictive Analytics: PFF College grades translation to NFL for pass-rushers | PFF College grades translation to NFL for QBs


 © 2025 PFF - all rights reserved.