A key area of focus for wide receivers in recent years is their ability to win at the next level, specifically how they perform on the outside, where press coverage is more common. The ability to win against press coverage and play on the outside was listed as a major concern for five of the 14 wide receivers in our PFF draft guide, including my top projected wide receiver, Treylon Burks.
Click here for more PFF tools:
Draft Guide & Big Board | Mock Draft Simulator
Dynasty Rankings & Projections | Free Agent Rankings | 2022 QB Annual
Player Grades
While the concerns about how well a top prospect performs against press coverage could be overblown, they’re not without merit. Replaceability is as much of a factor in draft value as usage, and a receiver who can beat press coverage is a rarer, necessary component of a successful passing game. It’s not surprising that the most coveted receivers selected in the first round of the NFL draft faced press coverage at a 10 percentage point higher rate than average in college.
Parsing how different usages and success rates against press coverage in college translate into NFL value is difficult, but separating press and “off” coverage routes provides some clarity.
In this analysis, I’ll focus specifically on wide receiver routes when they aren’t facing press coverage, i.e. off coverage. My previous analysis focused on receivers facing press coverage, and I’ll discuss at the end how combining these two reveals powerful insights.
To that end, I separated press and off coverage statistics for all college prospects going back to 2017, which is when PFF began tracking press coverage for non-targeted receivers. Then, I divided the prospects into similarity-based groups and looked at how often different groups were favored in the draft, and how much early career value they added according to PFF's wins above replacement (WAR) metric.
While a prospect's performance against press coverage is highly important for predicting if they can play on the outside in the NFL, it’s always important to keep relative sample sizes and their implications on the confidence of our assessments in mind. College wide receivers only face press coverage on 25% of their routes run, meaning there is three times as large of a sample of how they performed against off coverage compared to when pressed. Analysts have to balance the enhanced signal we get from the larger sample of off coverage routes against the ideal press usage for projecting a certain type of receiver prospect.
METHODOLOGY
To group receivers, I used k-means clustering, which allows us to choose the numbers of clusters before dividing the observations into that number of groups based on similarities in different features. For this, the following rate statistics against off coverage are used:
- Percentage of routes facing off coverage (Off coverage)
- Yards per route run (Yards per route)
- Average depth of target (Depth of target)
- Percentage of targets contested (Contest target)
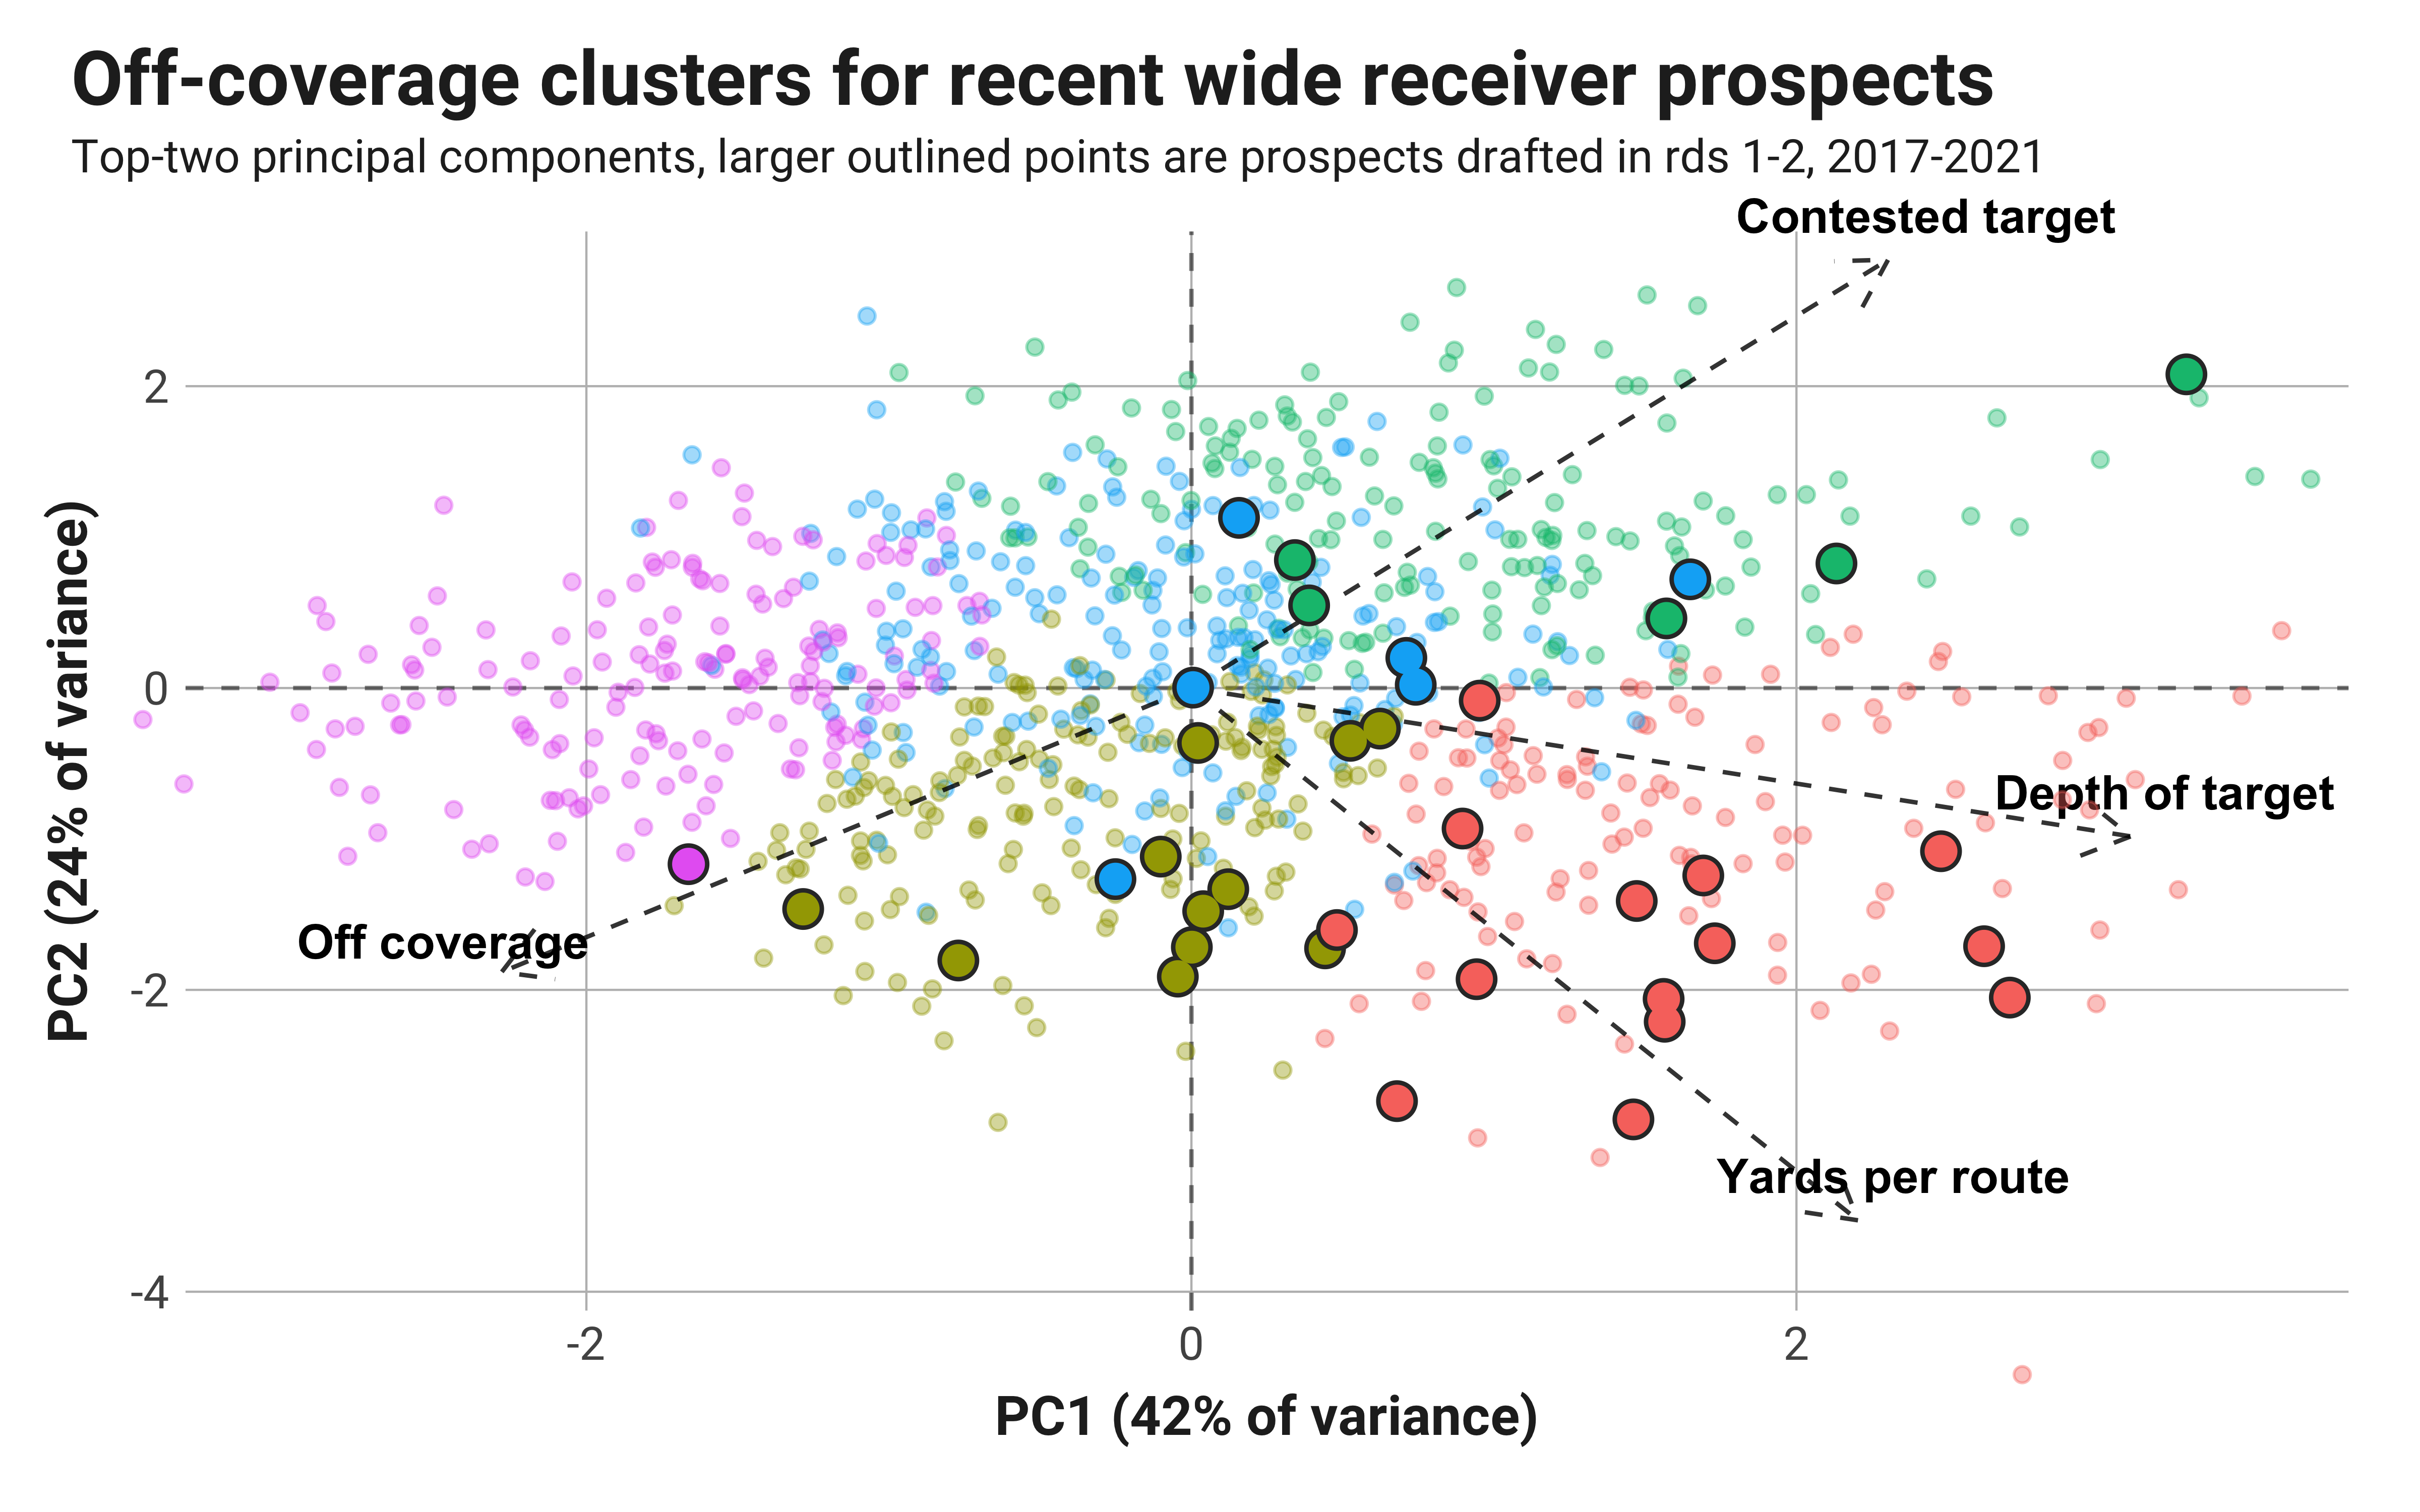
Feeding those four metrics over the final college seasons of more than a thousand college players into the k-means algorithm produces the following clusters.

The five clusters are identified by different colors, and the larger data points represent prospects who were selected in the first two rounds of the NFL draft. The axes are the two main principal components used in clustering, which is a fancy way of saying a mix of the different features in the best way possible for differentiation. The additional dashed arrows represent the directionality of each feature in the model — i.e., more efficient receivers against off coverage are further down and to the right. Those with greater average depths of target drift directly right, and those who relied more on contested catches against off coverage are further up and to the right. Tellingly, the percentage of routes against off coverage is almost directly oppositional in direction to contested catches against off coverage.

With the early draft picks highlighted, it becomes clear that efficiency and higher depth of target are related to better draft positions for wide receiver prospects while the percentage of contested targets and off coverage are more of a mixed bag. Very few high draft picks were poor performers in college, giving yards per route run the largest feature effect.
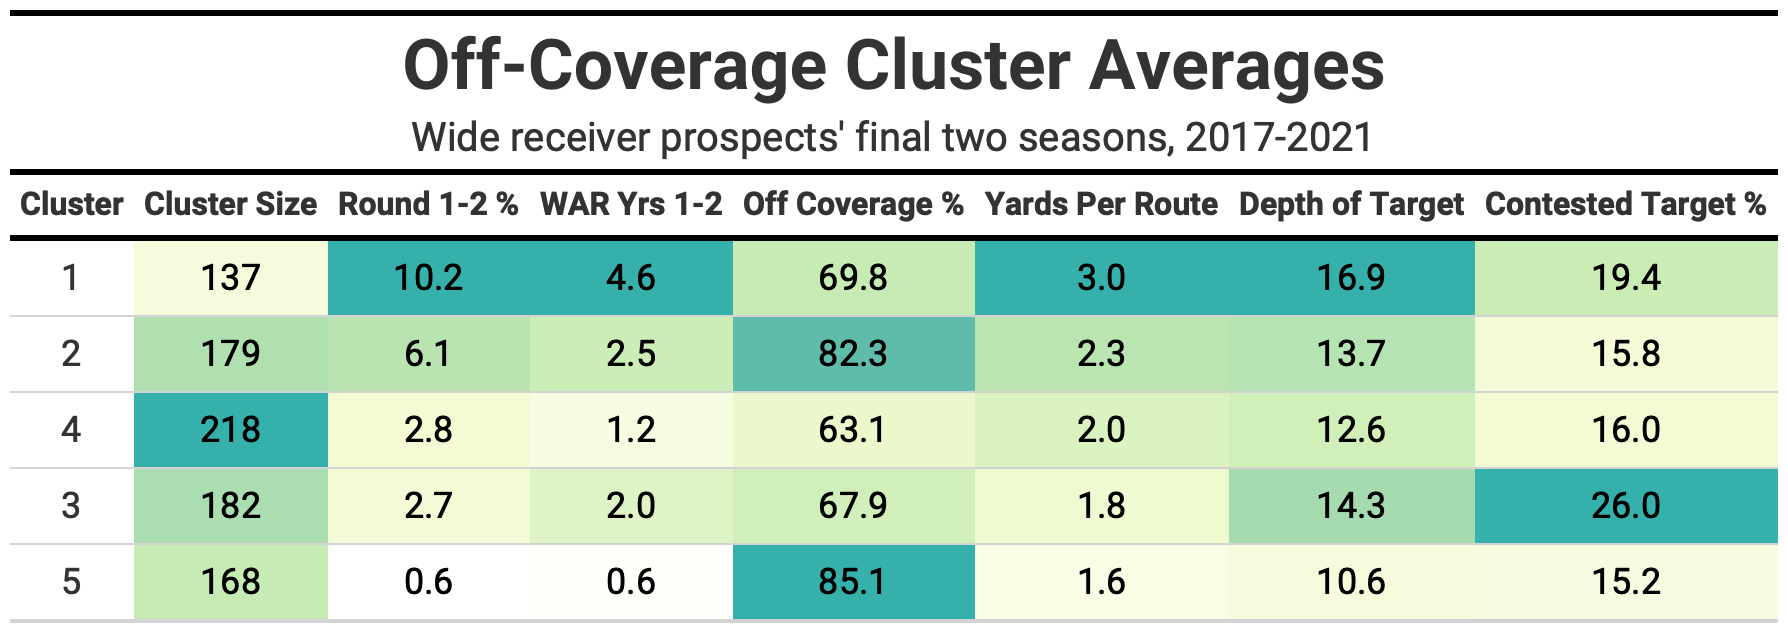
Looking at the five clusters' mean numbers, which are assigned randomly by algorithm, you get an idea of what receiver types fall into each cluster.

Cluster 1 is the smallest of the bunch and features the highest averages for yards per route run facing off coverage, depth of target, percentage of prospects drafted in the first two rounds and total WAR in the first two NFL seasons. This cluster has a lower percentage of routes against off coverage, meaning they were pressed more often. The percentage of contested catches falls in the middle, which could be a sweet spot for future NFL performance.
Now that you have an idea of what types of receivers comprise the clusters, let’s look specifically into each one in the order above and inspect the relevant prospects in the 2022 wide receiver draft class to see what the results tell us about their potential for success in the NFL.
Exclusive content for premium subscribers

WANT TO KEEP READING?
Dominate Fantasy Football & Betting with AI-Powered Data & Tools Trusted By All 32 Teams
Already have a subscription? Log in


 © 2025 PFF - all rights reserved.