The prospects who will hear their names called in the 2021 NFL Draft all have something in common: They are among the most talented football players in the world. But not every talented player progresses through college football in the same manner.
Some, such as Alabama wide receiver DeVonta Smith, have shown steady growth through college. Others, such as Clemson quarterback Trevor Lawrence, have been elite from the start and had little room to improve. Then there are those who only had one single year of solid production, the so-called one-year wonders.
In this year’s draft class, this group of one-year wonders includes Mac Jones, Caleb Farley, Jaelan Phillips and Joe Tryon. It’s noteworthy that the pandemic and subsequent opt-outs have only made this group larger this year.
In this article, we want to use PFF metrics to determine exactly what a “one-year wonder” is and investigate whether these players are generally drafted too high, too low or at the right spot.
View PFF's 2021 NFL Draft position rankings:
QB | RB | WR | TE | T | iOL | DI | EDGE | LB | CB | S
To define the term “one-year wonder,” we use a metric called WAA (wins above average), a metric very similar to PFF WAR (wins above replacement). The difference is that instead of comparing a player to a replacement-level player, we compare him to an average player, mostly because it’s very difficult to define “replacement level” in an environment as heterogeneous as college football.
The significant advantage of WAA is that it incorporates both quality and quantity of play. It helps us identify both one-year wonders who didn’t see the field before their last college season and one-year wonders who did play before their final season but failed to produce at an above-average level.
To identify the one-year wonders, we first look at two numbers: the total WAA a player generated throughout his college career and the WAA a player generated in his final college season. We divide the latter by the former and obtain the percentage of WAA generated in that last year. The higher that percentage, the more can we talk about a player as a one-year wonder.
For players who show steady growth throughout college, this number will usually be between 25% and 75%. Note that percentages above 100% are possible if a player produced a negative WAA before his final year and then managed to bring his total above zero with a good final year.
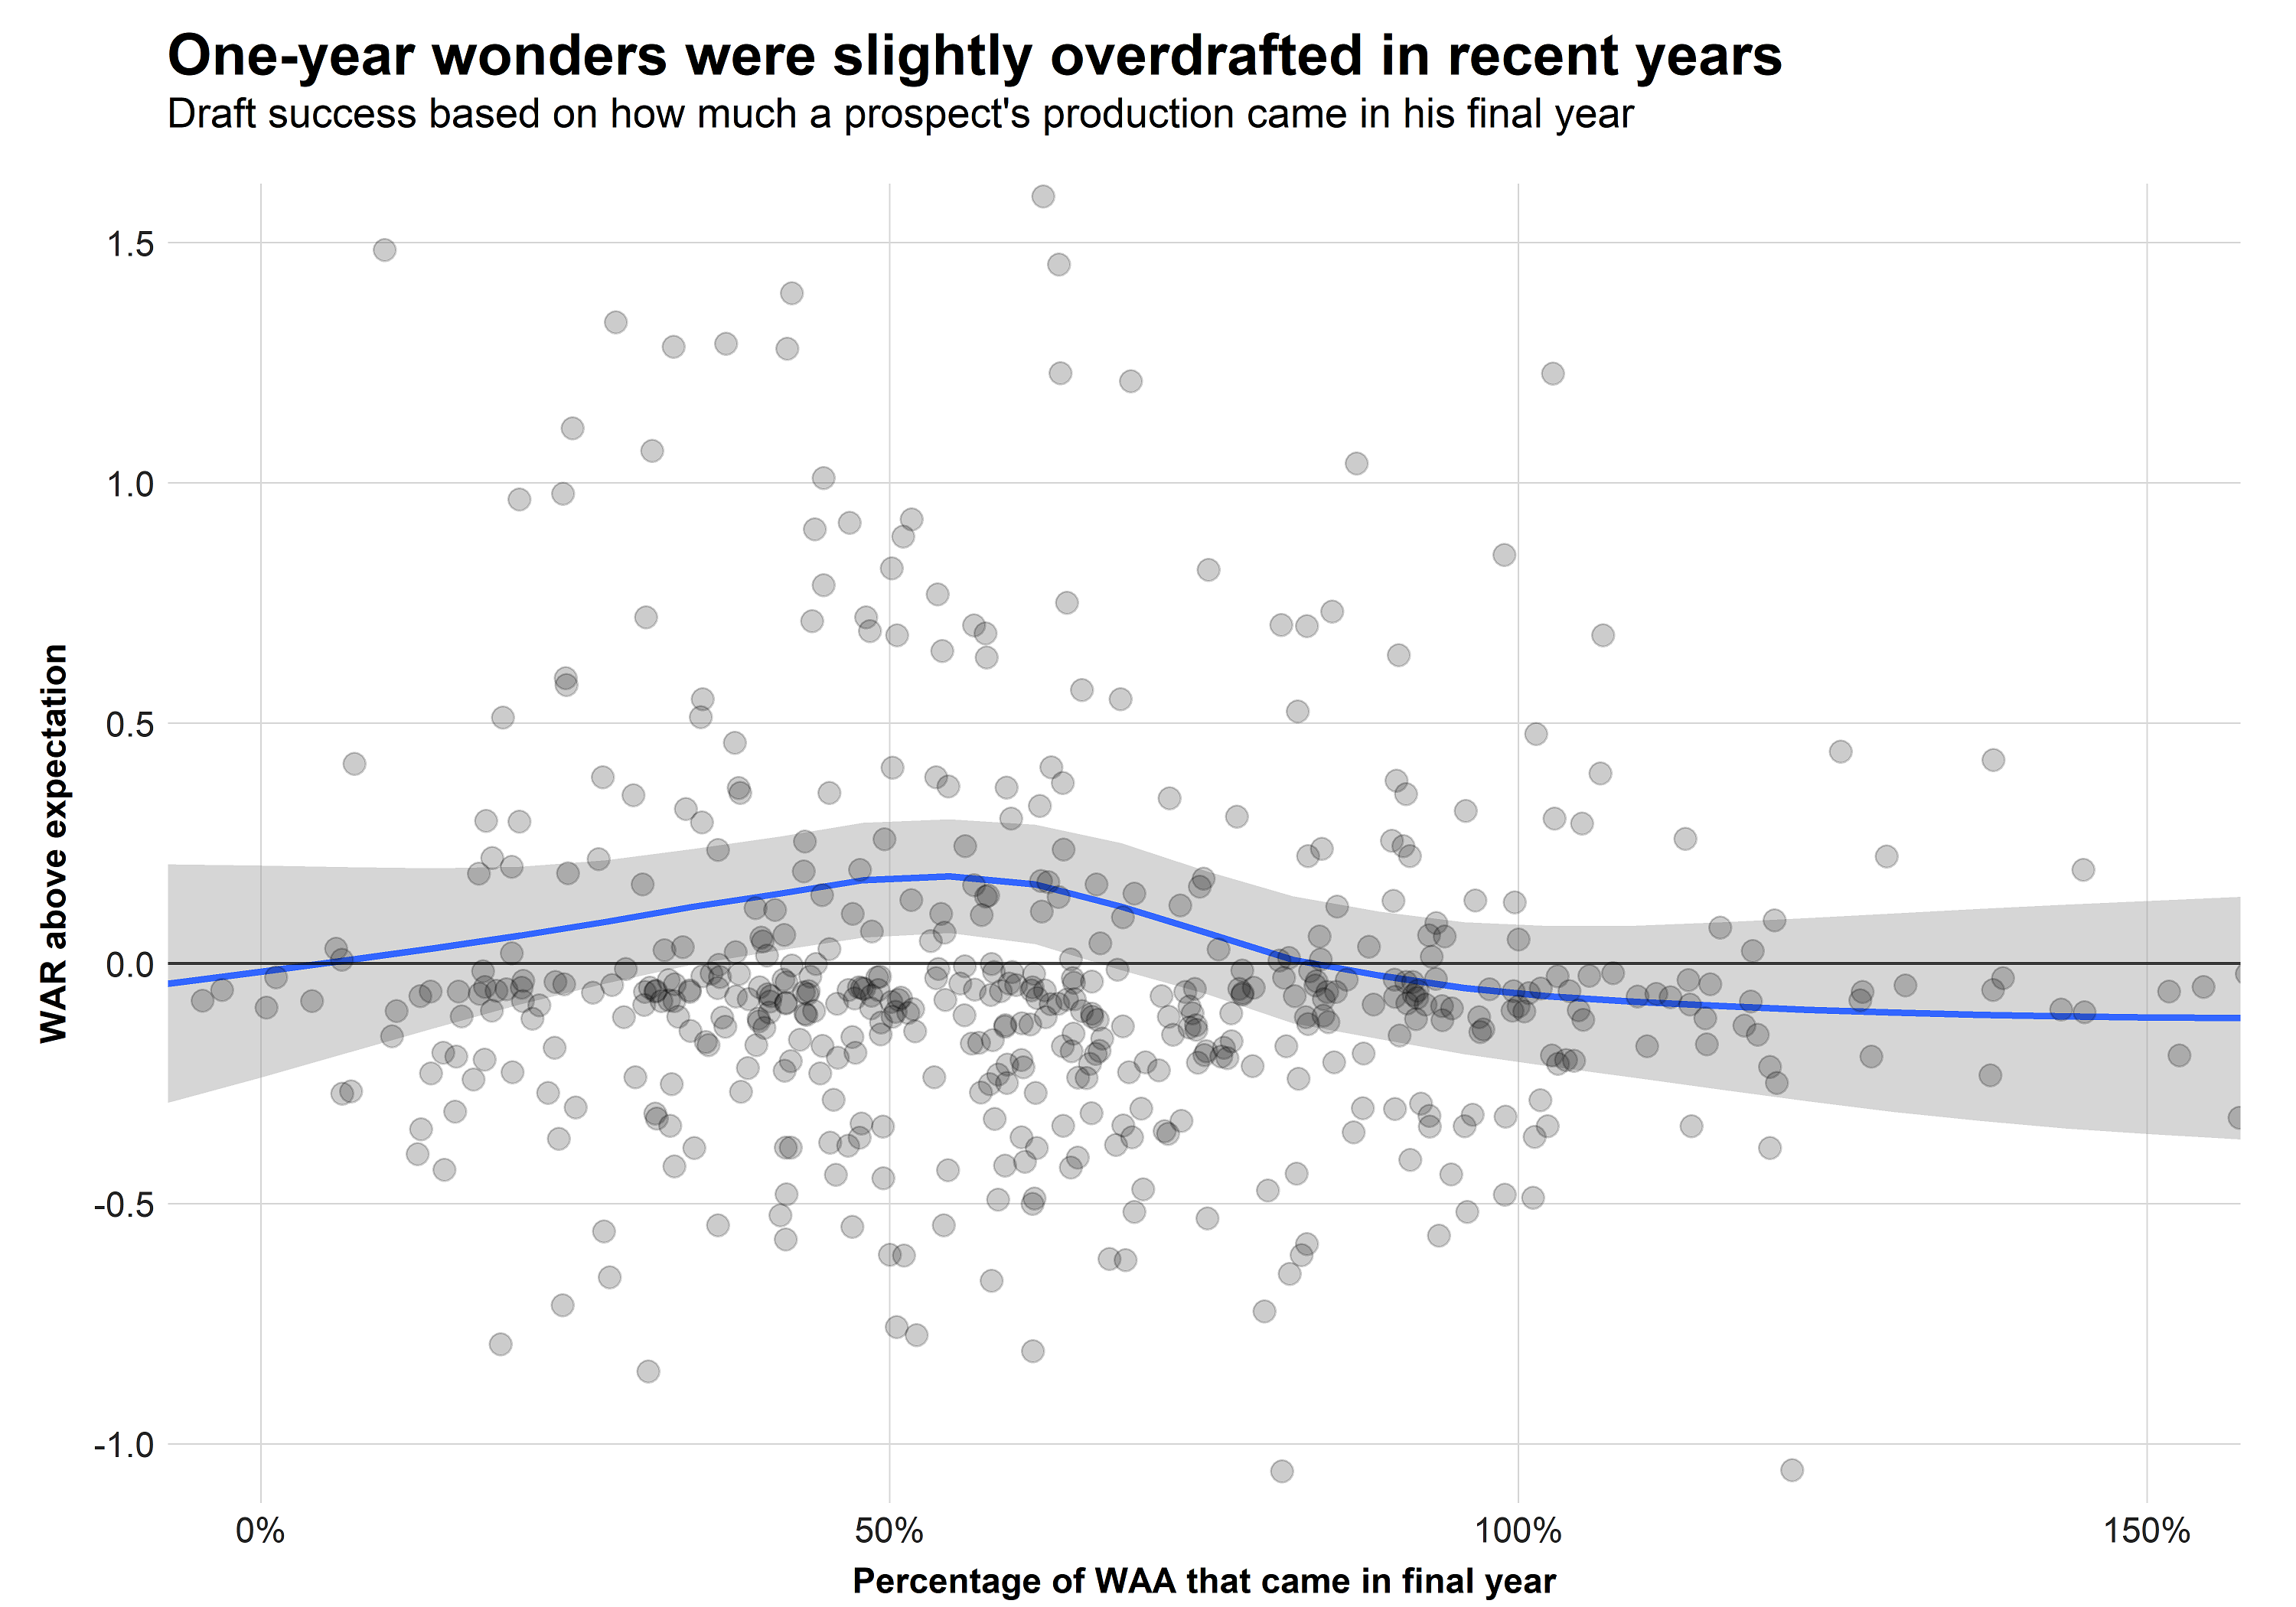
The following chart shows the players from the draft classes of 2016, 2017 and 2018. The percentage of WAA coming from the final year, as explained above, can be found on the x-axis. The y-axis describes draft success in the form of the four-year WAR compared to the expectation based on draft position.

We find that the model of steady growth has been the “sweet spot” over recent years. Players who generated around 50% of their total value in their final year have exceeded expectations based on their draft positions, while players who generated all of their value in the final year have generally not met expectations.
Additionally, the big draft hits — picks that generated close to a win or more over replacement — almost exclusively came from the group of players who have shown their potential before their final college season.
Given that the draft is considered to be even more of a lottery on Day 3, we will investigate whether we find the same trend among the top 100 picks.
Exclusive content for premium subscribers

WANT TO KEEP READING?
Dominate Fantasy Football & Betting with AI-Powered Data & Tools Trusted By All 32 Teams
Already have a subscription? Log in


 © 2025 PFF - all rights reserved.