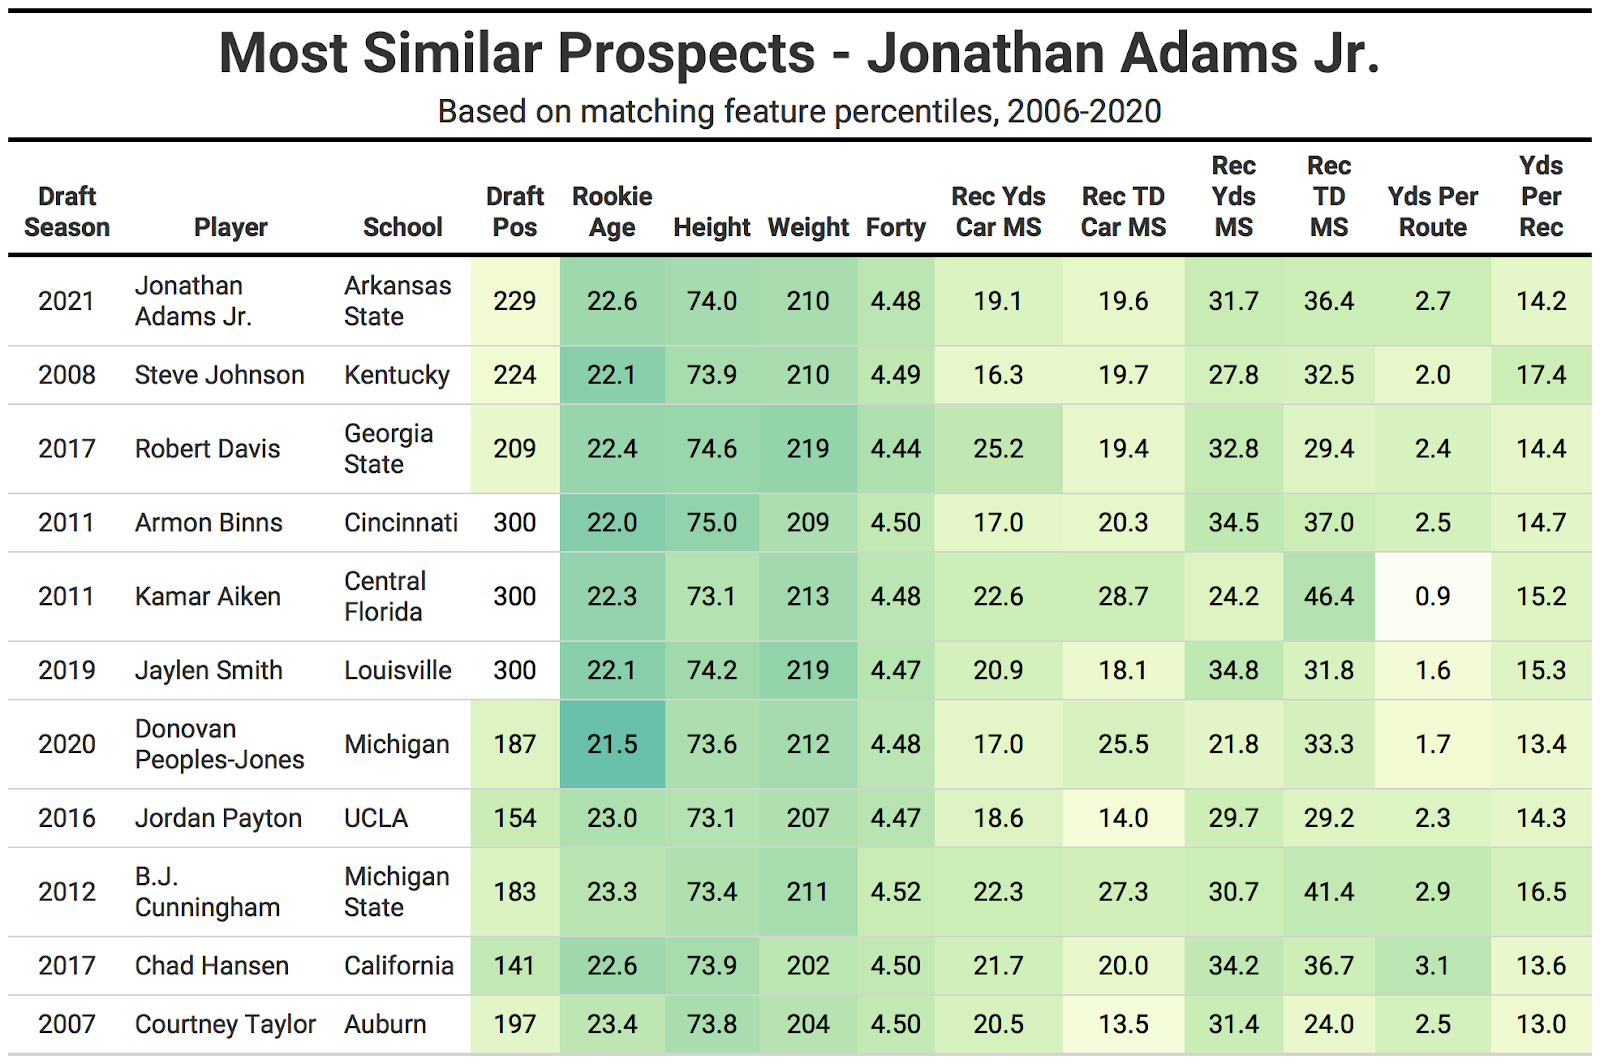
Comparing current NFL draft prospects to those of years past is standard procedure in draft evaluation, though most comparisons are built on the memory recall and subjective opinion of the particular evaluator.
This will be the first in a series of articles comparing the 2021 draft prospects to prior years and picking out the most similar comps with a clearly delineated and quantifiable method.
PFF data scientist Eric Eager has done tremendous work building college-to-pro projections, which are built off the robust college data we’ve collected since 2014 and have been applied to exercises like building an “Analytics” Mock. In this analysis, I will use some of our advanced stats for comparison but primarily rely on traditional stats to go back further to compare the 2021 prospects to draft classes going back to 2006.
Without the NFL Scouting Combine this season, the important measurables like weight and 40-yard dash will be reported through the various pro days that will be taking place over the next few weeks.
METHODOLOGY
The comps below were derived from a two-step process. First, I converted all the most statistically relevant stats and measurables to percentiles based on the thousands of prospects who have entered the NFL since 2006 at each position. Then, I filtered the total universe of past prospects by those who had draft positions, weight and 40 times within a 10th percentile in either direction of Jonathan Adams Jr. For undrafted players, I assigned a numerical draft position of 300.
The rest of the matching features were transformed by principal component analysis (PCA). I found the closest statistically comparable players by the euclidean distance between the players' principle components, listed in the top 10 below.
The metrics for PCA are: rushing attempts per game, rushing yards per game, rushing touchdowns per game, receptions per game and market share of team receptions. All of these data points come from the prospect’s best collegiate season. I also matched the prospect’s market share of total team yards and touchdowns to past draft prospects.
For Adams' draft position, I’m using an estimate based on the mock data collected at GrindingTheMocks.com. For weight and 40 time, I’m using the numbers from his pro day, with a 0.03-second penalty added to the 40 time to reflect the uncertainty of pro-day timed measurements.
Most comparable players
I’ve found modeling NFL performance at the wide receiver position that the most important variables for forecasting future success are a prospect’s career market share of team receiving yards and the career share of receiving touchdowns.

Steve “Stevie” Johnson is the only hit and also Adams’ closest comparable player. Adams and Johnson are nearly identical in measurables, and both only had one monster final season to rely on. The simple fact is that a receiver forecasted to go after pick 200 in the NFL draft is going to have limited success.
Exclusive content for premium subscribers

WANT TO KEEP READING?
Dominate Fantasy Football & Betting with AI-Powered Data & Tools Trusted By All 32 Teams
Already have a subscription? Log in


 © 2025 PFF - all rights reserved.