Last week we broke some ground at PFF and debuted a wins above average (WAA) model for college football. By using such a measure, we can look at how good a player is and how much his contributions mattered, given what positions he played and who he played against during the season.
As with anything developed in the analytics space, a good question is, “why does it matter?” In this article, we explore how WAA maps to draft position in the PFF College era (2014 – present). Since many players' full careers do not completely overlap with this timeframe, we have to be creative about how we measure a player’s college value.
WAA Earned in Final Season
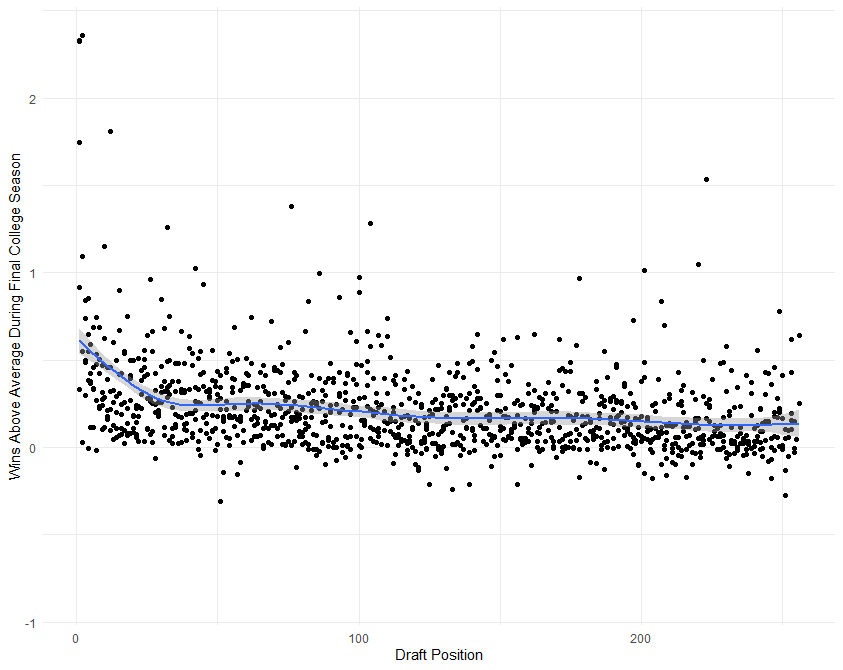
The relationship between WAA earned in a player’s final season and his draft position (conditioned on being drafted; there is certainly selection bias here) is non-linear, decreasing and concave up:

This is expected, as quarterbacks are the most valuable players and the most likely to be selected early in the draft. Additionally, in theory, the better the player is in college (and against the most impressive competition), the more highly he's regarded (and hence more highly drafted). Looking at the log-transformed draft position, we see a -0.41 correlation with final-season WAA. In this case, a negative correlation is good since it means higher WAA correlates with better (lower) draft position.
Maximum WAA Earned
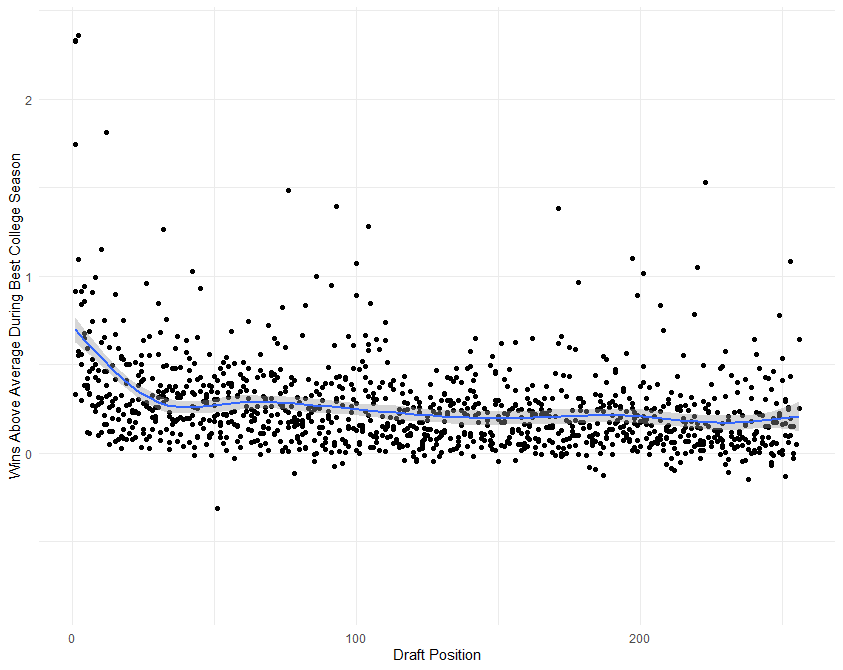
Another way to look at a player is through his maximum output or maximum WAA earned. If we do this, we see a similar curve as above:

The log of a player’s draft position correlates with maximum WAA at a rate of -0.40, which is very similar to his final-season WAR.
What if You Throw Out Quarterback?
Quarterbacks are outliers in terms of value and are generally represented by the dots well above the curves we drew above. If we extract quarterbacks from the sample, we get a correlation of -0.57 between the log of draft position and WAA. This is a very encouraging result for the efficacy of PFF WAA at the college level.
Now, About That Selection Question
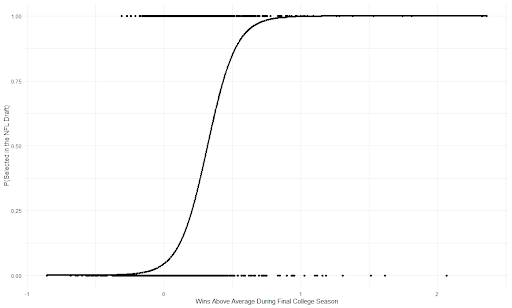
In many areas of science, there is what is called “zero inflation.” For example, when determining population density, one generally has to construct two models — one to find the probability that individuals are detected in the first place, and another to estimate the number of individuals detected (conditioned on detection). The first set of analyses done here is analogous to the latter, looking at draft position conditioned on the player being drafted.
Using a simple, general linear model, we find that WAA does a good job of determining the likelihood that a player is drafted based on his final-year WAA. For example, a 0.25 increase in final year WAA yields an increase of 2.4 on the log-odds scale.
Upcoming models will combine these two ideas to yield a college-to-pro prediction model using PFF WAA, along with other important features.

Looking at 2020’s Top Prospects
Our own Mike Renner recently wrote an updated mock draft, which can be found here. Here are some of the final-season WAA values for some of his top picks, which will shed light on our take regarding positional value:
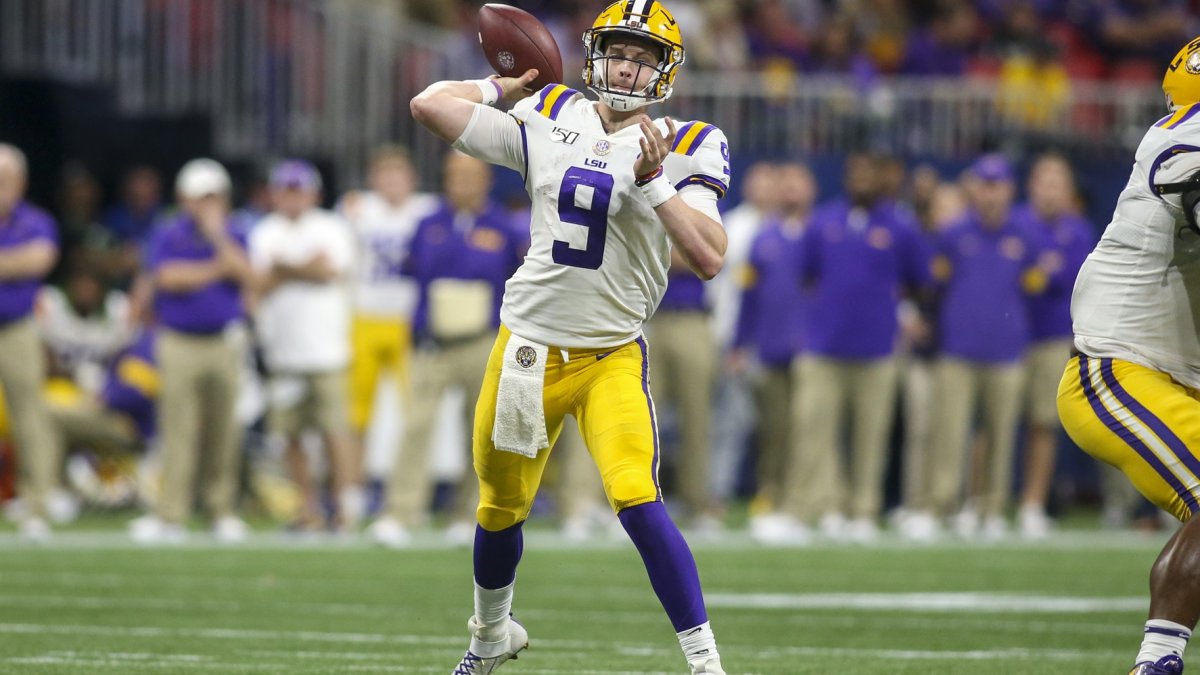
1. Cincinnati Bengals: Joe Burrow, LSU (2.16 WAA)
2. Washington Redskins: Chase Young, OSU (0.48)
3. Detroit Lions: Jeffrey Okudah, OSU (0.35)
4. New York Giants: Jedrick Wills, Alabama (0.20)
5. Miami Dolphins: Tua Tagovailoa, Alabama (0.51)
Drafting a Quarterback in Round 1? Buyer Beware
Quarterbacks are about three to four times as valuable as other positions at the top of the draft, so the urge to draft one high is understandable, even if that player is a reach. Here are the final-season WAA values for quarterbacks drafted in the first round since 2015:
2015: Jameis Winston (0.92), Marcus Mariota (2.36)
2016: Jared Goff (1.75), Carson Wentz (N/A), Paxton Lynch (0.96)
2017: Mitchell Trubisky (1.09), Patrick Mahomes (1.15), Deshaun Watson (1.81)
2018: Baker Mayfield (2.32), Sam Darnold (0.74), Josh Allen (-0.02), Josh Rosen (0.63), Lamar Jackson (1.26)
2019: Kyler Murray (2.33), Daniel Jones (0.69), Dwayne Haskins (0.90)
Burrow and Tua (given his limited time via injury) certainly generated the requisite value in their final years to warrant consideration in Round 1 and Jalen Hurts has the production (1.20) to warrant a look, but teams that buy into Justin Herbert (0.40), Jordan Love (0.0) or the recently declared Jacob Eason (0.27) might want to take the approach that Denver’s took last year, which was to draft someone like Drew Lock (1.03) later in the draft.


 © 2024 PFF - all rights reserved.