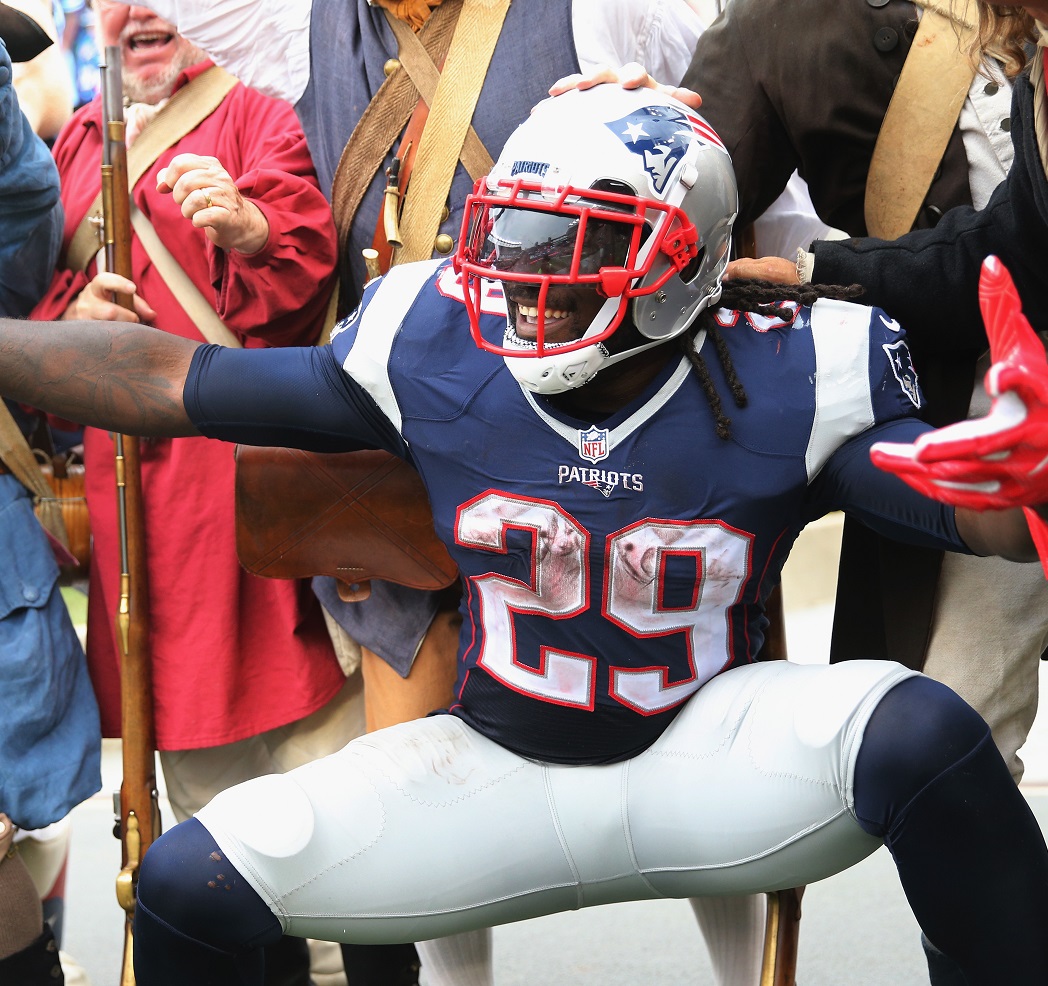
During the 2016 season, at the age of 30 (he turned 31 during the year), LeGarrette Blount was second in the NFL in rushing attempts, with 299. This is a bit strange, given his advanced age, but it’s not altogether surprising when you consider he was New England’s “closer,” and New England often found itself up big in the fourth quarter.
When the Patriots were expected to win big, it was colloquially known as a “Blount game.” The formula was simple: Big leads late in the game lead to more attempts for a bruising running back, which naturally leads to more fantasy points. Sign us up!
(Keep up with all of the Narrative Street series here.)
The narrative: Running backs feast late in the game when their team is up big
In a way, it’s sort of a reverse “garbage time.” When teams are losing big, they throw more — but as we learned in last week’s Narrative Street piece, garbage time isn’t all peaches and cream for quarterbacks and receivers.
But what happens when a team is winning big? Their running backs obviously get more opportunities (which is always a good thing) — but how valuable are those opportunities?
Blount, of course, isn’t the only running back who benefits from “Blount games.” What do the league-wide averages say?
The research
Like the passing-focused “garbage time” Narrative Street piece from last week, we don’t need research to know that the overall gist of the narrative is true. If you have a running back and their team is winning late in the game, and they are running more as a result, then the additional opportunities are a positive for your fantasy team. You should never shy away from extra opportunity.
But as I wrote last week, “that’s the boring way to approach the ‘garbage time’ discussion.” So I once again looked at the quality of garbage time opportunity versus opportunity in a more competitive game.
The formula was the same as the previous research piece — just in reverse (to account for leads instead of deficits). I looked at all games from the 2015 and 2016 NFL seasons and calculated the score margin in the fourth quarter. I then looked at all rushing attempts while the offensive team was either losing by up to 8 points, or winning by up to 24 points. This enabled us to look at running back efficiency numbers in close games (one-score contests), to marginally close games (two-score contests), to blowouts (three-score contests). There wasn’t quite enough data for me to feel confident in the conclusions drawn for 24-plus-point leads, so I stopped at 24.


 © 2025 PFF - all rights reserved.