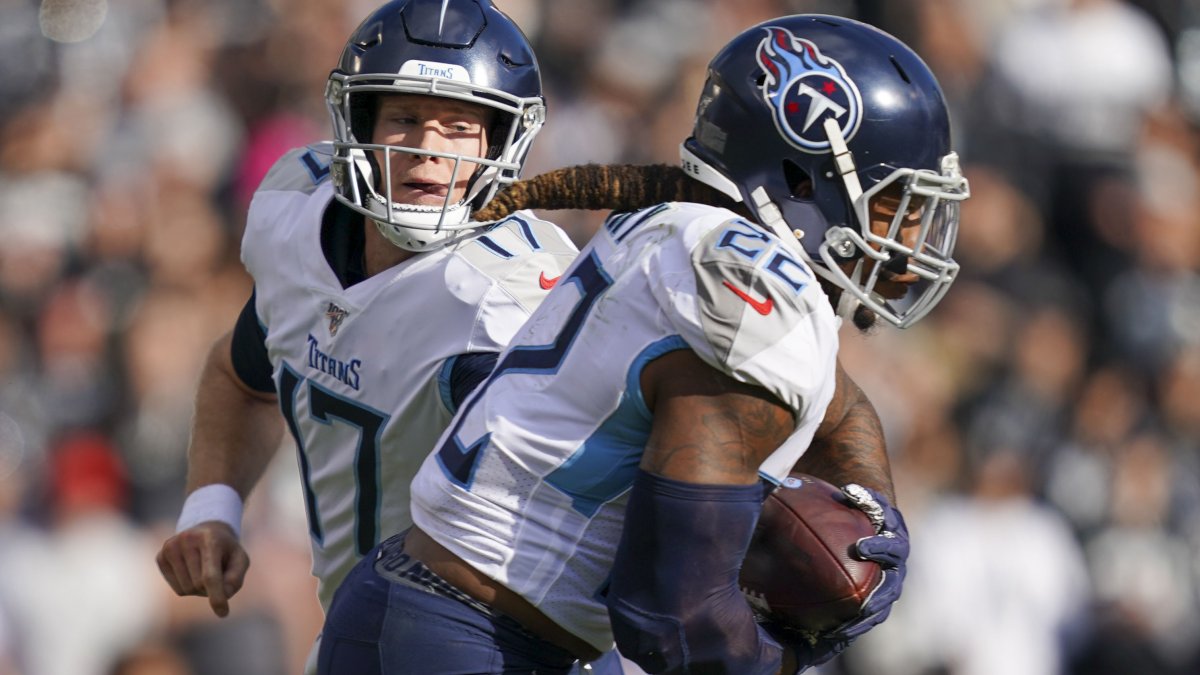
The playoffs finally came to a close for the Tennessee Titans Sunday, defeated at the hands of the Kansas City Chiefs. While they surely would have preferred to end the season hoisting the Lombardi trophy, making it to the NFL’s final four by dethroning the New England Patriots and dismissing the regular-season leading Baltimore Ravens was an accomplishment wildly beyond pre-season expectations.
The two players most closely associated with the Titans’ playoff run — at least on the offensive side of the ball — were quarterback Ryan Tannehill and running back Derrick Henry. The story of Tannehill would have provoked laughter only a few months ago. Henry was a favorite to win the rushing title in the offseason, but Tannehill was traded to the Titans from the Dolphins as an insurance plan, not to contend for most efficient quarterback and be named Comeback Player of the Year.
Unfortunately, the Titans brass doesn’t have much time to celebrate its successful season. Both of their offensive pillars will be 2020 free agents, without a contract extension or the application of a franchise or transition tag. The Titans should want to maintain their core and make another playoff run next season, but at what cost?
How much the Titans should pay Tannehill and Henry gets to fundamental questions of forecasting performance and positional replaceability. I’m going to walk through how to frame these questions from an analytical perspective, leveraging advanced statistics like expected points added and PFF’s propriety wins above replacement metric. We’ll also look to the past for the best comparable players to Tannehill and Henry, and how valuable they were to their teams after similar seasons.
The options
If all parties can find mutually agreeable terms, Tannehill and Henry could sign contract extensions before the clock strikes 4 p.m. New York time March 18, when they become unrestricted free agents. But the Titans don’t have to convince Tannehill and Henry to extend before that date. Either can be removed from the free agent pool by designation as a franchise or transition player.
The franchise and transition tags allow teams to maintain rights to a player, but at a cost. For the franchise tag, that cost is a one-year contract for an amount no less than the average of the top five salaries at the player's position. For this cost, the team retains the rights to negotiate with that player through most of the offseason. The transition tag comes at a lower cost, but also opens up the possibility that another team can offer the player a contract, which then needs to be matched by the current team if they want to retain him.
Teams can designate one player to each type of tag during the offseason, though the franchise tag has been used more frequently. There have been only four players designated on the transition tag the since 2014, versus 33 franchise tagged.
OverTheCap.com projects the franchise and transition tag numbers for 2020 below.
| Position | Franchise | Transition |
| QB | $26.9M | $24.4M |
| RB | $12.5M | $10.2M |
Running backs come at less than half the quarterback price, though not necessarily a bargain versus value (as we’ll discuss more below). The Titans can ensure that neither Tannehill nor Henry hit the market by using the franchise tag on one and transition on the other, a unique circumstance because NFL's current collective bargaining agreement is in its final year.
Positional value
Most NFL fans understand that a running back’s ability to influence the outcome of games is lesser than that of a quarterback, but the importance of the distinct comes in the matter of degree. Despite record-breaking performances in the first two rounds of the playoffs, Henry wasn’t leading anything close to a record-breaking offense.
The leading analytical metric for measuring team value on a play-by-play basis is expected points added, which translates down, distance, and field position into expected scoring in terms of points. We can calculate the expected points difference before and after plays to determine how they affected each team’s likelihood to score. It isn’t a precise science, but apportioning the EPA for each play to those players most clearly involved gives us a foundation for understanding value, especially for comparing runs and passes.
When you put historical EPA generation for quarterbacks and running backs together on the same scale, it becomes clear how massive the upside is for the former. The plot below does this, and also has our grade-based wins above replacement on the other axis. Our WAR metric incorporates a) how well the player performed b) what the player did and how important that task is to winning football games and c) how often did the player do the various things he did.
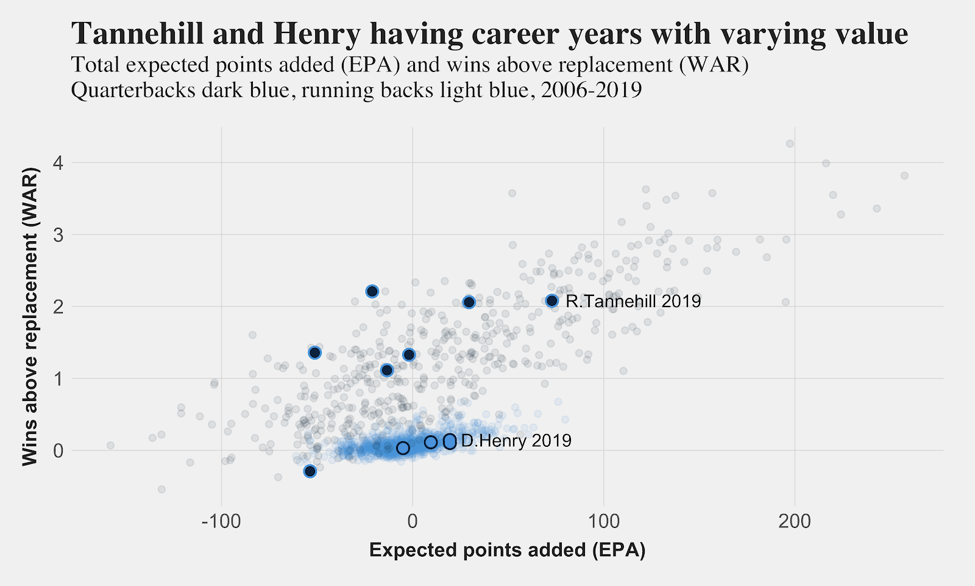
The range of WAR and EPA outcomes for the darker blue points representing quarterbacks is wide and tall, reflecting the cumulative upside for throwing the ball down the field in larger chunks rather than grinding out first downs on the ground. Most of the high-leverage (i.e. big EPA swing) plays are passes in the NFL, and drives are largely kept alive on third down through the air.
Tannehill hasn’t been the most valuable quarterback and has had some dud seasons (especially 2018, shown in the plot with negative WAR). But 2019 was his highest total EPA season, and, on a per-play basis, his best season of WAR production. Henry also had his best season by advanced metric, but the impact of his run-dominant usage is nothing compared to that of a player involved in every passing play. Henry had a great running-back season, but the concentration of light blue running-back season in the plot illustrates how little the differentiation is between good and great for the position.
Henry’s comps and value
One of the better ways to conceptualize the value of a player is to compare him to his most similar historical examples. By doing so, we can see how subsequent performance for these players varied from the past and our expectations.
The plot below gives the headline numbers for the 12-closest Henry comps from 2008 to 2018 based on a number of matching features: age (+/- 1.5 years), weight, rush grade, route grade, WAR, WAR per snap, rushing attempts per game, targets per game, and previous year WAR. The black line from 2018 to 2019 shows the actual WAR values for Henry, while the green, blue and red lines represent the ceiling, mean and floor outcomes going forward derived from Henry’s 12 closest historical comps.
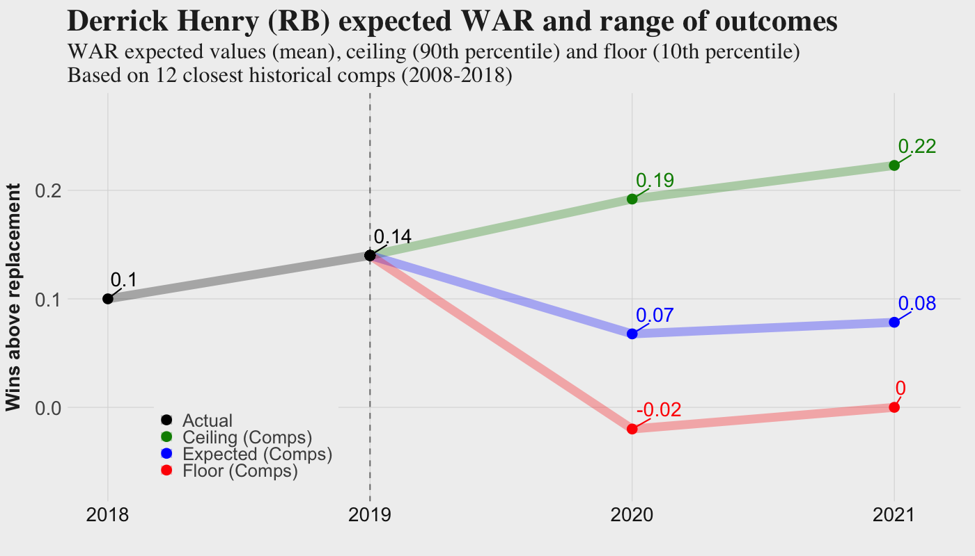
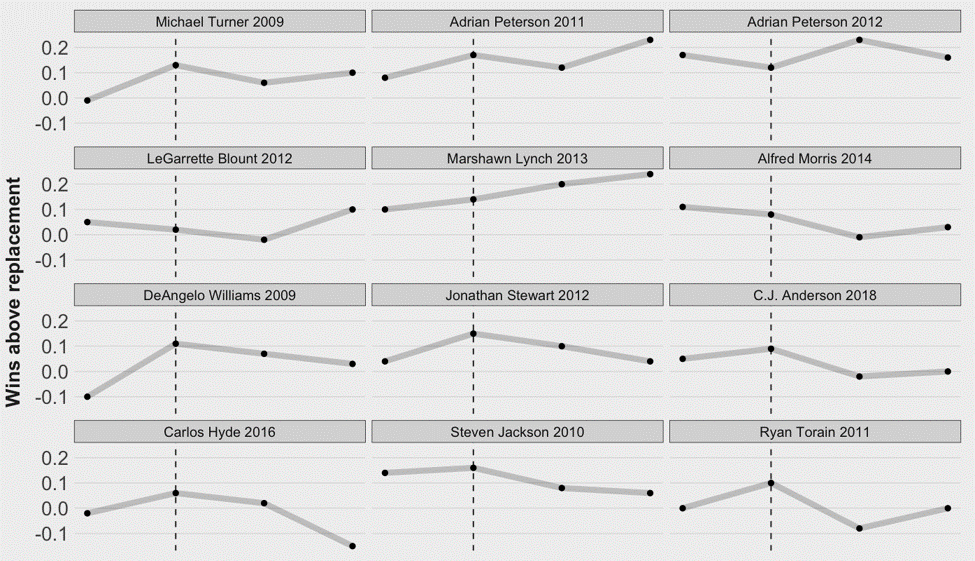
Looking specifically at the 12 comparable players, we can see a wide range among the biggest, run-dominant backs that align with Henry’s profile. The upside is someone like Marshawn Lynch, the downside Carlos Hyde or C.J. Anderson.
Based on previous contract and salary cap research, the upside outcome for Henry of roughly 0.2 WAR per season equates to a contract worth $10-14 million per season the next two year. These numbers fall roughly in line with the franchise and transition tag amounts, though significantly trail recent extensions for Ezekiel Elliott and Todd Gurley that were around $15 million per season, and look questionable, at best, in light of subsequent performance.
The problem using these amounts is that they represent the upside for Henry, which come from players like Adrian Peterson and Marshawn Lynch. If likely Hall of Famer is your valuation estimate, that doesn’t leave much room for a player to disappoint and still be a value.
Tannehill’s comps and value
The plot below from Tannehill uses a similar comparable player matching technique, though using more appropriate quarterback features: age (plus/minus one year), pass attempts per game, WAR, WAR per snap, and previous-year WAR.
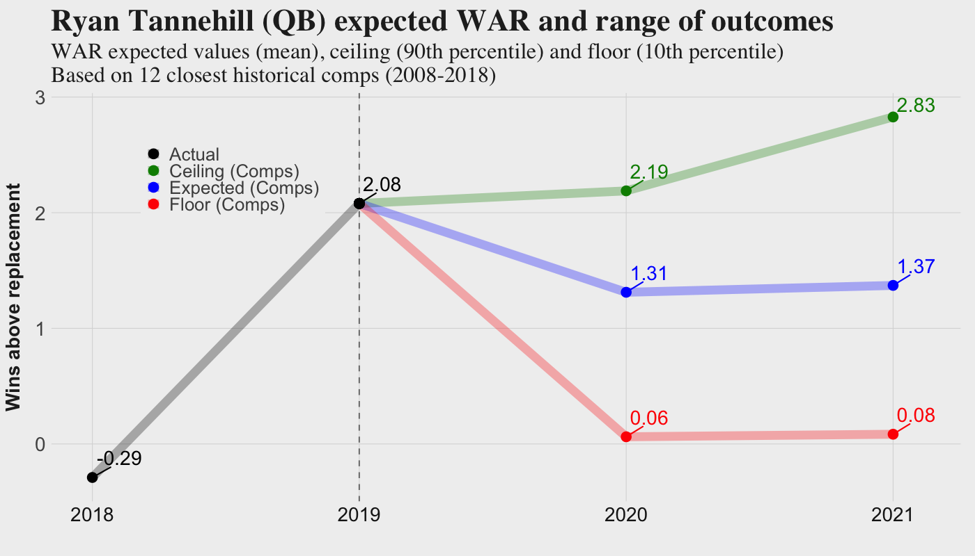
Tannehill’s jump from below replacement level in 2018 to over two WAR in 2019 is nearly unprecedented. As you’ll see in the individual comps below, often an injury is needed to produce a similar rebound. Tannehill’s had the sixth highest WAR of 2019, and second best if measured on a per-snap basis.
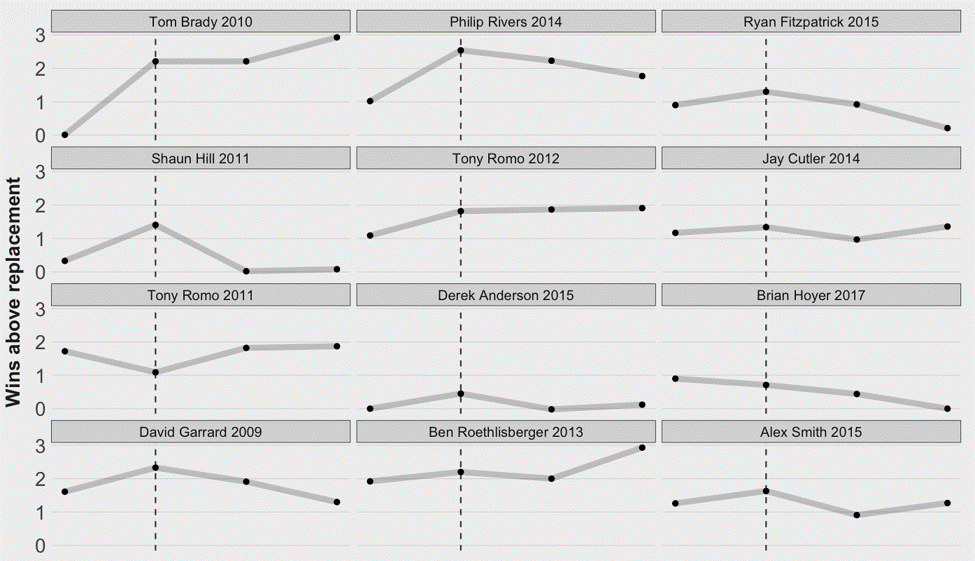
Tom Brady as the most similar Tannehill comps show the good and bad of a numbers-based matching algorithm: you get injuries confused with bad season, and you get an idea of just how great Tannehill’s 2019 truly was. Many other names on the list were top quarterbacks, and likely outside of Tannehill’s tier, at least to this point in his career. At the same time, comparisons to Derek Anderson and Brian Hoyer are probably doing Tannehill a disservice.
The free-market value for one or two games of WAR for other positions is astronomical, but the quarterback value question can’t be detached from what you can get from another quarterback in a trade (like Tannehill last offseason) or as a free agent. You might get similar value from a would-be target like Cam Newton, but that possibility is weighed down by the possibility you miss out altogether while losing one of last season’s most valuable players.
The broad picture that comes away from Tannehill’s comp-based WAR projection is that of a real franchise quarterback, and one who would be relatively valuable at the estimated $27M franchise tag. If the Titans can get Tannehill to sign a multi-year deal in that annual range with team protections that shorten the guaranteed window, it could be a sensible compromise in lieu of another season of uncertainty.